As soon as you have one server, you might be tempted to do some log analysis. That can be to get some metrics from your Apache logs, your spam filter, or whatever time-stamped data your server collects. You can easily find small tools, or even create a home-made solution to extract info from these files.
Now imagine you have 100, 200, or even thousands of servers. This home-made solution you've created no longer suits your needs.
Different powerful products exist, but I'll focus on two of them: Splunk on one side, Logstash+Elasticsearch+Kibana on the other side. This post is dedicated to Splunk. Logstash will come later.
Both softwares are tools. These are not all-in-one solution. Exactly like a spreadsheet software which is unable to calculate your taxes unless you design a specific table to do so, you must use the software to create value from your logs. Installing and feeding logs into the software is not the end of your work, it's the very beginning.
Splunk is a commercial product. It's incredibly powerful out of the box, and its documentation is very good. Every aspect of the software is covered in depth with numerous examples. It also has an official support. Unfortunately Splunk is very (very) expensive, and no official rates are available online. Hiding the cost of a software is often the promise you won't be able to afford it.
Splunk is well packaged and will run effortlessly on many common systems. At least for testing. Scaling up requires some work. I've been told that apparently, scaling up to more than few TB of daily logs can be difficult, but I don't have enough technical details to make a definitive statement about this.
Rest assured that Splunk is a very nice piece of software. It took me only an hour from the time I've installed it on a FreeBSD server, to the time I've produced a world map showing spam filter action breakdown by location:
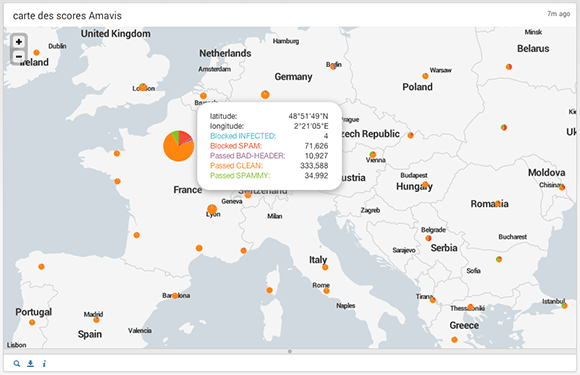
One hour. This is very short, almost insane. The map is fully interactive, and you can click any pie chart to display the table of values and the search request allowing you to create this table:
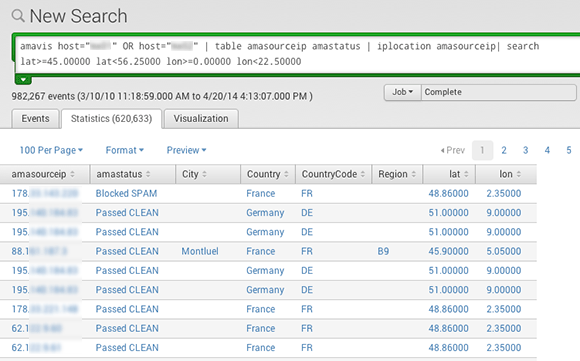
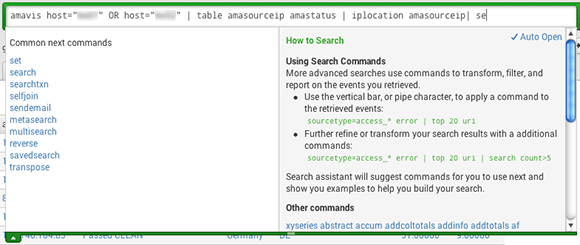
The query syntax is quite pleasant and almost natural. The search box is very helpful and suggests "Common next commands", or "Command history" alongside with documentation and example:
Splunk has some other killing features like users management and access control, assisted (almost automated) regex design for field extraction, or its plugin system. The Field extraction "wizard" is quite impressive, as it allows you to extract new fields out of already indexed logs, without writing any regex nor re-indexing your logs. You just browse your logs, paste samples of data you want to extract, and it builds the filter for you.
Transactions are also a pretty damn great feature: they make correlation of different events possible (login and logout, for example), so that you can track complex behaviors.
More importantly, Splunk appears to be simple enough so any sysadmin wants to use it and does not get rebutted by it's complexity. It's a matter of minute(s) to get, for example, the total CPU time involved in spam filtering last month (~573 hours here). Or if you want, the total CPU time your antispam wasted analyzing incoming emails from facebook (~14.5 hours). But it's definitively a very complex software, and you have to invest a great deal of time in order to get value (analytics designed for you) from what you paid for (the license fees).
I love Splunk, but it's way too expensive for me (and for the tax payers whose I use the money). So I'm currently giving Logstash a try and I'm quite happy about it.