[This is the English translation by DeepL]
[Version originale en français]
Restoration
From the previous article, we know how the backup process works in Borg, Kopia and Restic. Now we'll take a look at restoration and maintenance.
Restoration is a stage in the life of a backup, which - when all goes well - is never used. So it's understandable that the benchmark for this stage isn't overly interesting or representative. Tracing was done in the original backup script, but restoration was not performed every day.
The test consisted in restoring a 39 MB zip archive from the oldest snapshot available in the archive, as well as restoring a Library/Preferences directory from the oldest of the last 10 snapshots. The size of the directory varies from one backup to the next, but is generally around 290 MB for 951 directories and ~15K files.
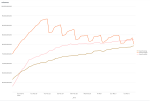
During this restoration test, the difference between the three programs is once again very marked. Borg receives around 575 MB of data from the server. It sends around 6 MB of data. Kopia is a slightly better pupil, performing the same restoration with only 450 MB of data received and around 20 MB sent. But it's Restic that has the smallest network footprint, managing to perform the expected full restore with just 120 MB of data received and 0.5 MB of data sent.
| Borg | Kopia | Restic | |
|---|---|---|---|
| avg in | -575.00 MB | -447.76 MB | -120.82 MB |
| avg out | 5.92 MB | 20.59 MB | 0.52 MB |
In terms of restoration time, Restic is also in first place, with a task completed in 8 seconds, while Kopia takes between 12 and 14 seconds and Borg between 18 and 19 seconds. These are still relatively short times, and although the differences may be significant in proportion, they remain fairly small in absolute terms.
As far as restoration is concerned, Restic is the clear winner, well ahead of Kopia. Borg comes last, not least because of its network consumption.
| Borg | Kopia | Restic | |
|---|---|---|---|
| restoration time | - | - | + |
| network volume | - | - | + |
Maintenance
The first maintenance task, and also the easiest to measure, is the "plum" phase. This task aims to remove obsolete archives, snapshots and restore points. It is essential to ensure that the backup repository does not explode out of control. It is this step that is responsible for ensuring compliance with the user's retention policy.
I detailed in my previous article how retention management can be full of surprises. I won't return to that particular point. Here, I'll focus on the resource consumption involved in these operations.
Note that Kopia spontaneously performs the cleanup operation when a new backup is launched, without needing to be asked to do so. To be able to measure this operation independently, I had to schedule it just before the backup operation (and not after, as initially planned).
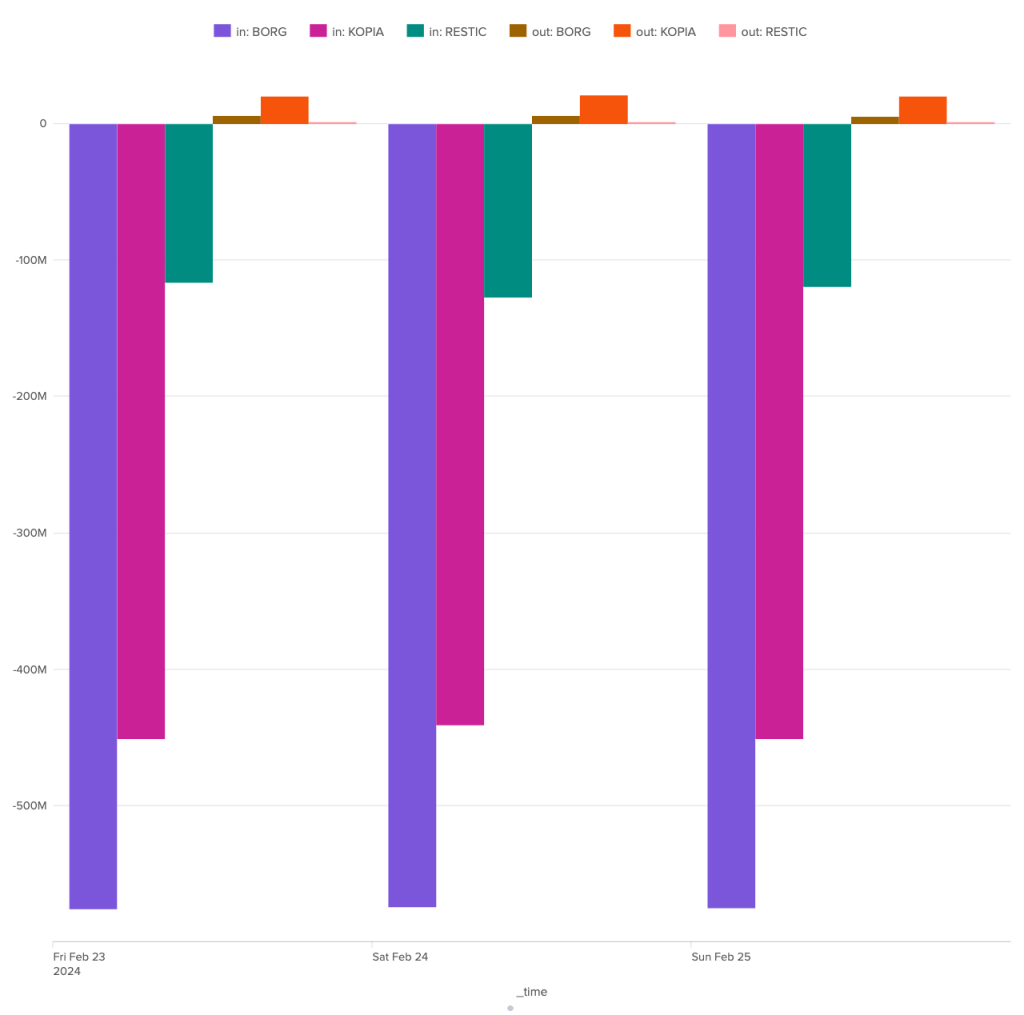
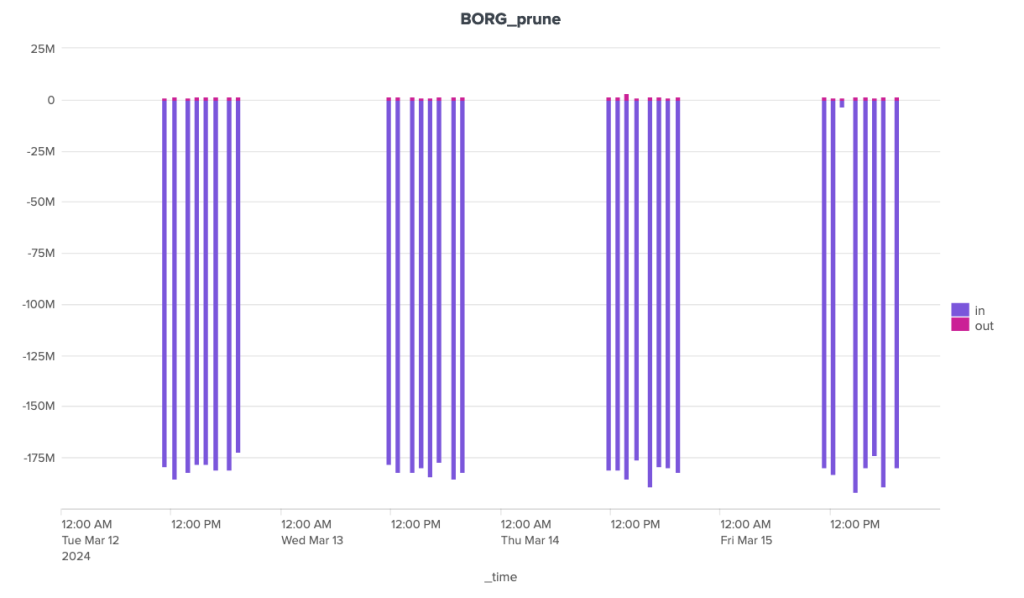
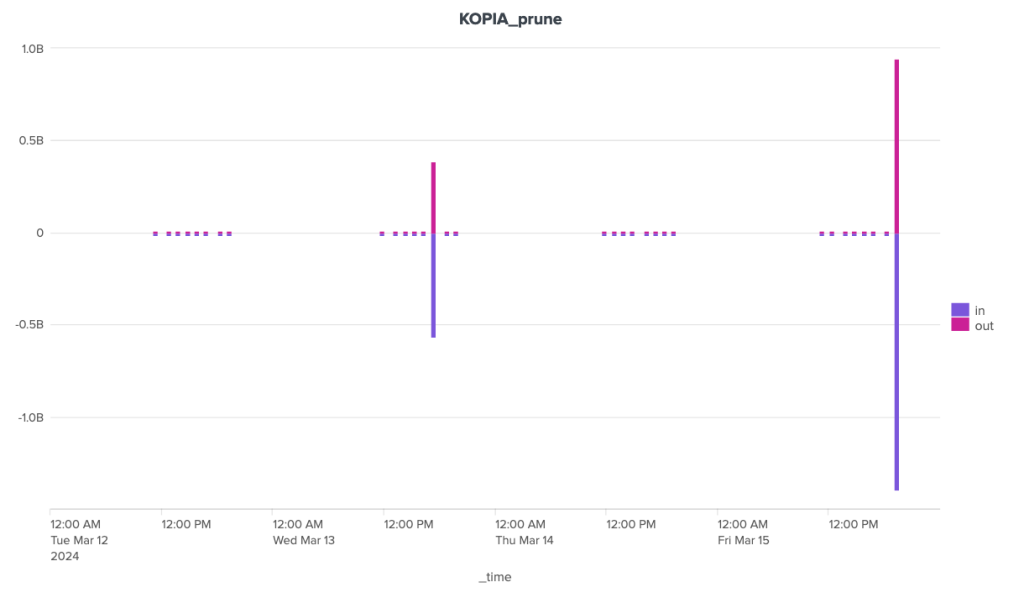
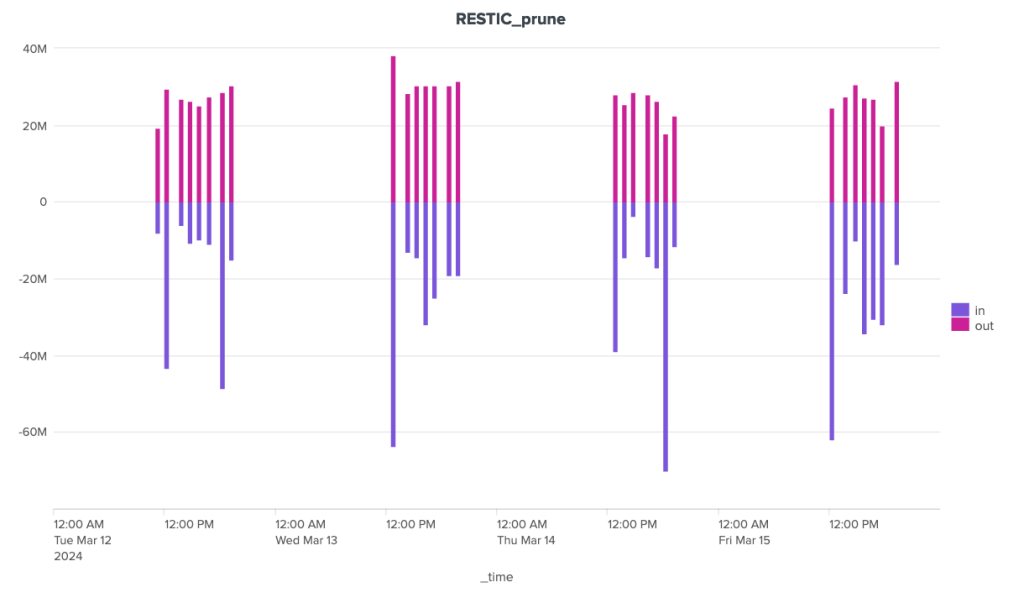
The bandwidth consumption of the cleanup operation is surprising, to say the least. Borg is the software that stands out here for its great regularity, with around 180 MB of incoming data and 1.3 MB of outgoing data. For the other two, the situation is much more chaotic. Kopia seems to behave in a fairly stable way over time, with incoming data extremely limited to ~92 Kb and outgoing data to a volume of around 70 Kb, but there are some huge anomalies, with certain clean-up operations showing incoming transfers approaching 1.4 GB and outgoing transfers close to 1 GB. It seems that these peaks can be attributed to other maintenance tasks (see below).
Restic also shows great irregularity in the volumes of data exchanged with the server during cleaning operations. Nevertheless, volumes remain under control, well below the 40 MB mark for outgoing data and the 70 MB mark for incoming data.
4-day figures, mid-March
| Borg | Kopia | Restic | |
|---|---|---|---|
| avg in | -175.65 MB | -62.02 MB | -24.74 MB |
| avg out | 1.34 MB | 42.23 MB | 27.55 MB |
| median in | -181.02 MB | -95 KB | -16.97 MB |
| median out | 1.31 MB | 70 KB | 28.01 MB |
| perc98 in | -190.17 MB | -879.78 MB | -66.49 MB |
| perc98 out | 2.27 MB | 599.28 MB | 34.52 MB |
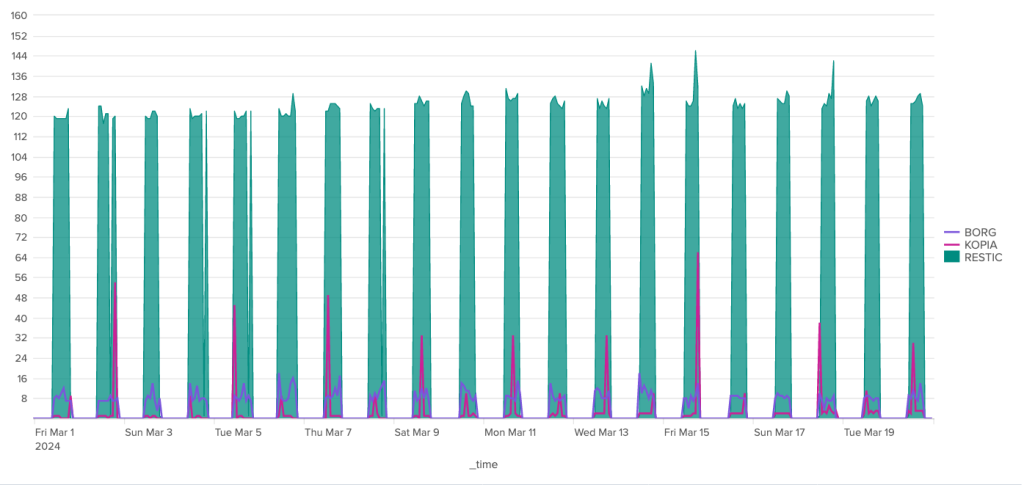
Over the duration of the cleaning stages, Borg and Kopia are relatively well-placed, with Kopia showing some significant peaks and Borg a certain regularity. Restic, on the other hand, is in last place, with a significant gap to these two competitors.
4-day figures, mid-March
| avg | median | perc98 | |
|---|---|---|---|
| Borg | 9.30 s | 9.00 s | 14.90 s |
| Kopia | 4.41 s | 2.00 s | 33.00 s |
| Restic | 113.50 s | 126.00 s | 140.20 s |
To conclude on the subject of cleaning, I'll give first place to Kopia, as the anomalies observed are most certainly due to automatic snapshot/repository verification operations, which are handled automatically by this software.
| Borg | Kopia | Restic | |
|---|---|---|---|
| cleaning time | + | + | - |
| network volume | - | + | + |
Other maintenance tasks relate to checking backups and the backup repository. Like cleaning, checking snapshots and the health of the repository is handled automatically by Kopia (at least in theory). For Borg and Restic, these operations have to be planned in addition to the rest.
These operations are considered rare, some even exceptional (such as depot repair operations). I have therefore decided not to measure them over the long term, nor to draw any statistics from them. I've simply taken a few measurements on specific tasks.
Borg
$ time borg check --rsh "${SSH}" ${HOMEREPO}

real 8m36.258s
user 4m49.125s
sys 0m25.353s
This operation consumes 100% CPU on the client side (python) and 0% CPU on the server side.
$ time borg check --verify-data --rsh "${SSH}" ${HOMEREPO}

real 26m0.151s
user 15m9.882s
sys 2m37.629s
This operation has phases with 100% CPU on the client side (python) and 1% CPU on the server side (python) and other phases with 50% python + 35% ssh on the client side and 50-60% sshd + 30-40% python on the server side.
$ time borg check --repair --repository-only --rsh "${SSH}" ${HOMEREPO}
This is a potentially dangerous function.
check --repair might lead to data loss (for kinds of corruption it is not
capable of dealing with). BE VERY CAREFUL!

Type 'YES' if you understand this and want to continue: YES

real 3m29.619s
user 0m0.252s
sys 0m0.088s
The latter loads almost exclusively the server: 0% CPU on the client side and 85% CPU on the server side.
Note that this repair was carried out in a vacuum, as the repository is in perfect health.
Kopia
$ time kopia maintenance run
Running full maintenance...
Looking for active contents...
Looking for unreferenced contents...
GC found 16436 unused contents (1.3 GB)
GC found 16550 unused contents that are too recent to delete (1.2 GB)
GC found 409930 in-use contents (73.3 GB)
GC found 28 in-use system-contents (71.6 KB)
Previous content rewrite has not been finalized yet, waiting until the next blob deletion.
Found safe time to drop indexes: 2024-04-06 15:51:09.649426 +0200 CEST
Dropping contents deleted before 2024-04-06 15:51:09.649426 +0200 CEST
Looking for unreferenced blobs...
  deleted 100 unreferenced blobs (2 GB)
Deleted total 138 unreferenced blobs (2.5 GB)
Cleaning up old index blobs which have already been compacted...
Cleaned up 8 logs.
Finished full maintenance.

real	0m9.883s
user	0m15.166s
sys	0m6.066s

$ time kopia maintenance run
Running full maintenance...
Looking for active contents...
Looking for unreferenced contents...
GC found 0 unused contents (0 B)
GC found 18882 unused contents that are too recent to delete (1.6 GB)
GC found 409930 in-use contents (73.3 GB)
GC found 23 in-use system-contents (56 KB)
Rewriting contents from short packs...
Total bytes rewritten 649.4 MB
Found safe time to drop indexes: 2024-04-06 15:51:09.649426 +0200 CEST
Dropping contents deleted before 2024-04-06 15:51:09.649426 +0200 CEST
Skipping blob deletion because not enough time has passed yet (59m59s left).
Cleaning up old index blobs which have already been compacted...
Cleaned up 0 logs.
Finished full maintenance.

real	0m27.121s
user	0m29.134s
sys	0m11.207s
Note the difference between the two runs, which are only a few seconds apart.
$ time kopia snapshot verify --verify-files-percent=10 --file-parallelism=10 --parallel=10
Listing blobs...
Listed 4141 blobs.
Processed 0 objects.
Processed 12137 objects.
Processed 17883 objects.
Processed 20581 objects.
../..
Processed 365793 objects.
Processed 368714 objects.
Finished processing 389361 objects.

real	3m26.325s
user	0m52.439s
sys	0m48.059s
Kopia has the interesting feature of being able to check only a percentage of the files in a backup (in this case 10%).
CPU consumption is distributed as follows: 30-60% CPU on client and server 80-90% CPU for sshd + 15-20% CPU for sftpd.
Checking 100% of files simply lengthens the operation:
$ time kopia snapshot verify --verify-files-percent=100 --file-parallelism=10 --parallel=10
Listing blobs...
Listed 4034 blobs.
Processed 0 objects.
Processed 4566 objects.
Processed 4577 objects.
Processed 4594 objects.
../..
Processed 372956 objects.
Processed 373370 objects.
Finished processing 393794 objects.

real	15m54.926s
user	5m37.337s
sys	4m3.843s
Restic
$ time restic -r rest:http://192.168.0.22:8000/ check
using temporary cache in /var/folders/1t/fbr0pvvc8xjg8f006s7cd4280000gp/T/restic-check-cache-2552920101
repository 9c062709 opened (version 2, compression level auto)
created new cache in /var/folders/1t/fbr0pvvc8xjg8f006s7cd4280000gp/T/restic-check-cache-2552920101
create exclusive lock for repository
load indexes
[0:00] 100.00%  6 / 6 index files loaded
check all packs
check snapshots, trees and blobs
[3:46] 100.00%  55 / 55 snapshots
no errors were found

real	3m48.649s
user	2m24.891s
sys	0m31.295s
$ time restic -r rest:http://192.168.0.22:8000/ check --read-data
using temporary cache in /var/folders/1t/fbr0pvvc8xjg8f006s7cd4280000gp/T/restic-check-cache-448461585
repository 9c062709 opened (version 2, compression level auto)
created new cache in /var/folders/1t/fbr0pvvc8xjg8f006s7cd4280000gp/T/restic-check-cache-448461585
create exclusive lock for repository
load indexes
[0:00] 100.00%  6 / 6 index files loaded
check all packs
check snapshots, trees and blobs
[3:46] 100.00%  55 / 55 snapshots
read all data
[10:36] 100.00%  4588 / 4588 packs
no errors were found

real	14m23.868s
user	6m55.821s
sys	1m45.116s
Data verification consumes 45-55% CPU on the client side and around 67% CPU on the server side.
$ time restic -r rest:http://192.168.0.22:8000/ repair snapshots
repository 9c062709 opened (version 2, compression level auto)
found 1 old cache directories in /Users/patpro/Library/Caches/restic, run `restic cache --cleanup` to remove them
[0:00] 100.00%  6 / 6 index files loaded

snapshot 09e89c9e of [/Users/patpro] at 2024-04-04 11:38:02.747322 +0200 CEST)

snapshot 0cf2fd62 of [/Users/patpro] at 2024-04-01 19:20:10.583797 +0200 CEST)

../..

snapshot fbeb283e of [/Users/patpro] at 2024-03-17 19:17:04.390071 +0100 CET)

snapshot fec2f8b1 of [/Users/patpro] at 2024-04-07 17:15:45.588862 +0200 CEST)

no snapshots were modified

real	3m22.149s
user	3m15.453s
sys	0m9.031s
Here, CPU consumption is around 100% on the client side and 0% on the server side. In principle, it works entirely on the client from the local cache. If the local cache is unavailable, Restic rebuilds it and server CPU consumption peaks at over 80%.
Overview
Relative to the number of snapshots/archives and the size of the repositories, the exhaustive verification times are as follows:
| Borg | Kopia | Restic | |
|---|---|---|---|
| Number of snapshots | 72 | 26 | 55 |
| Repository size | 78.4 GB | 74.5 GB | 80.5 GB |
| Per snapshot | 22s | 37s | 18s |
| Per GB | 19.9s | 12.9s | 10.7s |
Borg and Restic are fairly close in terms of performance when it comes to verifying backed-up data, but Borg is a hair slower while consuming more CPU on the client. In the end, Kopia is much slower than the other two.
I briefly mentioned Restic above, and the same applies to the other two: these programs use a local cache system to speed up some operations. The size of this cache can be very important in some contexts, and seems to be proportional to the number of unique data blocks saved on the repository (at least this is the case for Borg). I'm unable to present reliable figures for Borg due to an oversight on my part: having not relocated Borg's cache for my experiment, it got mixed up with the cache of my other Borg repositories (those of my real backups), so its volume is not comparable with that of other softwares.
That said, here's some information:
| Borg cache size, all mixed up | 7.1 GB |
|---|---|
| Borg cache size, test, late isolated | 828 MB |
| Kopia cache size | 6.2 GB |
| Restic cache size | 11 GB |
The "Borg cache size, test, isolated late" corresponds to a cache for Borg, dedicated to my test script, created 2 days earlier. It immediately reached 828 MB and hasn't grown since.
In any case, Restic is the big loser here, and if we relate the size of the cache to the number of snapshots/archives on the repository, then Borg is the winner.
| Borg | Kopia | Restic | |
|---|---|---|---|
| Check duration | + | - | + |
| Local cache size | + | - | - |
During this experiment, I was pleased to discover that Kopia manages maintenance operations for the user, which the other two programs have to launch explicitly. I also found Kopia's option to check a fraction of the files interesting. Finally, I like the fact that Restic offers an option for the cleaning operation, allowing the user to vary the cursor between performance and storage optimization.