Recherche Administrateur/trice Systèmes

Au sein du Service Opérations de la DSI de l'Université Lyon 2, nous cherchons un ou une Administrateur/trice Systèmes pour renforcer notre équipe et nous aider à relever des défis au quotidien.
Lieu de travail : campus de Bron (arrêt de tram T2 Europe Université).

  • Vous habitez la région Lyonnaise ou êtes mobile ;
  • Vous êtes motivée par les enjeux de la gestion d’un parc de plus de 600 serveurs Linux RedHat/CentOS (70%), Windows, FreeBSD ;
  • Les problématiques d’une ferme de virtualisation multi-site avec balance de charge, PRA, sauvegardes croisées ne vous font pas peur ;
  • Les infrastructures à fort enjeu de disponibilité, les outils d’automatisation, de monitoring et les SIEM vous intéressent ;
  • Vous êtes passionnée par les problématiques système et souhaitez évoluer dans un environnement riche et varié ;
  • Vous êtes curieuse, très rigoureuse et vous avez le sens du service.

Si vous vous reconnaissez dans ce profil, contactez-moi !

terminal - édition d'un script shell

Édition d'un script shell dans le terminal

Related posts

Recherche Administratrice/teur Systèmes en alternance

Au sein du Service Opérations de la DSI de l'Université Lyon 2, nous cherchons un ou une Administrateur/trice Systèmes en alternance pour nous aider à relever des défis au quotidien.
Lieu de travail : campus de Bron (arrêt de tram T2 Europe Université).

  • Vous habitez la région Lyonnaise ;
  • Vous êtes motivée par les enjeux de la gestion d’un parc de plus de 400 serveurs Linux RedHat/CentOS (70%), Windows, FreeBSD ;
  • Les problématiques d’une ferme de virtualisation multi-site avec balance de charge, PRA, sauvegardes croisées ne vous font pas peur ;
  • Les infrastructures à fort enjeu de disponibilité, les outils d’automatisation, de monitoring et les SIEM vous intéressent ;
  • Vous êtes passionnée par les problématiques système et souhaitez évoluer dans un environnement riche et varié ;
  • Vous êtes curieuse, très rigoureuse et vous avez le sens du service.

Si vous vous reconnaissez dans ce profil, contactez-moi !

terminal - édition d'un script shell

Édition d'un script shell dans le terminal

Related posts

Redis au secours de la performance du filtrage bayésien de SpamAssassin

Compte tenu des masses titanesques d'emails qu'un serveur peut être amené à traiter quotidiennement, l'optimisation des performances pour son logiciel de filtrage antispam est primordiale. C'est encore plus vrai si vous pratiquez le before queue content filtering.

Depuis plusieurs mois, vraisemblablement suite à une mise à jour d'une librairie ou d'un composant de l'antispam, j'ai constaté sur le SMTP authentifié @work un délai de traitement anormal dans certains cas. La durée normale pour le filtrage d'un message se situe entre 0 et 1 seconde, et pour une portion non-négligeable d'entre eux, cette durée passe à 30 secondes presque tout rond :

normal :                    anormal : 

elapsed: {                  elapsed: {
 Amavis: 0.059               Amavis: 0.267
 Decoding: 0.019             Decoding: 0.026
 Receiving: 0.002            Receiving: 0.002
 Sending: 0.027              Sending: 0.229
 SpamCheck: 0.156            SpamCheck: 30.113
 Total: 0.224                Total: 30.398
 VirusCheck: 0.003           VirusCheck: 0.008
}                           } 

Une recherche en mode debug m'a rapidement orienté vers un souci avec le filtrage bayésien :

SA dbg: locker: safe_lock: created /.../bayes.lock.foobar.19635
SA dbg: locker: safe_lock: trying to get lock on /.../bayes with 0 retries
SA dbg: locker: safe_lock: trying to get lock on /.../bayes with 1 retries
SA dbg: locker: safe_lock: trying to get lock on /.../bayes with 2 retries
SA dbg: locker: safe_lock: trying to get lock on /.../bayes with 3 retries
SA dbg: locker: safe_lock: trying to get lock on /.../bayes with 4 retries
SA dbg: locker: safe_lock: trying to get lock on /.../bayes with 5 retries
SA dbg: locker: safe_lock: trying to get lock on /.../bayes with 6 retries
SA dbg: locker: safe_lock: trying to get lock on /.../bayes with 7 retries
SA dbg: locker: safe_lock: trying to get lock on /.../bayes with 8 retries
SA dbg: locker: safe_lock: trying to get lock on /.../bayes with 9 retries

Ces 10 tentatives de prise de verrou ont souvent lieu 3 fois de suite, et chaque série dure 10 secondes : mon délai de 30 secondes est trouvé.
Le problème se trouvant du côté des fonctions d'accès à la base de données bayésienne, j'ai deux options : le résoudre ou le contourner. Le résoudre impliquerait probablement plusieurs journées d'analyse très fine et surtout de nombreux tests intrusifs sur une machine de production : pas envisageable.

J'ai donc pris le parti remplacer le stockage bayésien basique (Berkeley DB) par un stockage "haute performance" basé sur une base de données Redis.

Le changement est très simple à implémenter et totalement réversible. Le serveur Redis étant déjà installé sur la machine pour recueillir les logs détaillés d'Amavisd-new, il y a très peu de modifications à apporter pour y stocker les "seen" et les "token" de SpamAssassin.

Le support de Redis est inclus nativement dans Spamassassin depuis la version 3.4.0. Il suffit donc de placer les bons réglages et de recharger amavisd-new :

Dans le fichier /usr/local/etc/mail/spamassassin/local.cf on ajoute les lignes suivantes :

	bayes_store_module  Mail::SpamAssassin::BayesStore::Redis
	bayes_sql_dsn       server=127.0.0.1:6379;password=foo;database=3
	bayes_token_ttl 21d
	bayes_seen_ttl   8d

Et on recharge amavisd-new avec la commande sudo amavisd reload.

Il faut ensuite utiliser sa-learn pour faire apprendre à la nouvelle base vierge 200 messages de spam et 200 messages de ham, sans quoi la base bayésienne ne sera pas utilisée lors de l'analyse antispam.

Le gain de performance est immédiat : comme il s'agit d'une base de données NoSQL en mémoire, il n'y a pas de contrainte de verrou sur des fichiers, et la très forte concurrence des requêtes n'est plus un souci.

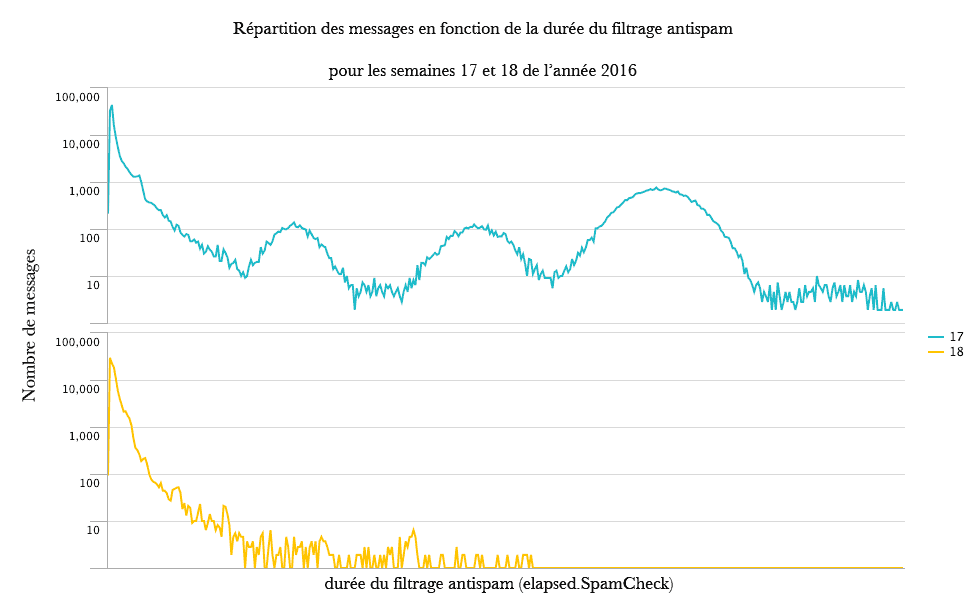
Entre la semaine 17 et la semaine 18 on constate la disparition quasi-totale des longs temps d'analyse, notamment dans la zone des 30 secondes (attention à l'échelle log) :

nbr_msg_pr_duree_antispam

Les trois bosses se situent respectivement autour de 10, 20 et 30 secondes. On remarque aussi que les performances de cette semaine 18 (avec Redis) sont meilleures que celles d'une semaine précédant l'arrivée du problème (bosse à 10 secondes) :

nbr_msg_pr_duree_antispam2

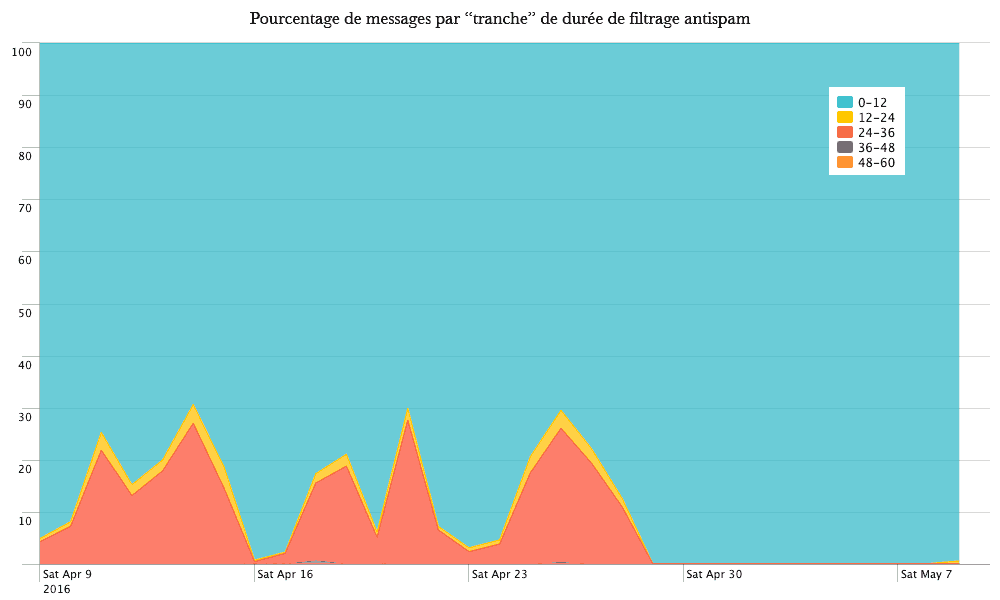
Une autre représentation des mêmes données montre de manière spectaculaire l'amélioration des temps d'analyse :

repartition_msg_pr_duree_pcent

Cette modification relativement simple améliore clairement le ressenti des utilisateurs du serveur SMTP (ie. qui ne passent pas par une interface "webmail"). Leur client de messagerie ne les fera plus attendre 30 secondes par envoi lors des périodes de forte affluence, et le filtrage en Before Queue est préservé. Le meilleur des deux mondes !

Related posts

Mise à jour FreeBSD : impact sur SSL/TLS

Dans le cadre de mon travail, j'administre quelques serveurs de messagerie à fort trafic. Certains tournent sous FreeBSD. Toute modification de ces serveurs, clés de voûte de notre infrastructure de messagerie, doit se faire avec prudence et en comparant leur fonctionnement avant et après le changement. Je suis aidé en cela par Splunk, un collecteur de logs qui me permet de faire des analyses poussées.
Splunk est notamment très doué pour afficher des tendances, des évolutions, et permettre de représenter quelques secondes ou minutes vos données sous forme graphique. Notamment, à chaque mise à jour de l'antispam, de l'antivirus, de Perl ou d'autres composants critiques, il me permet de vérifier en quelques instants que le temps de traitement des messages dans les différents filtres n'est pas dégradé par la mise à jour.
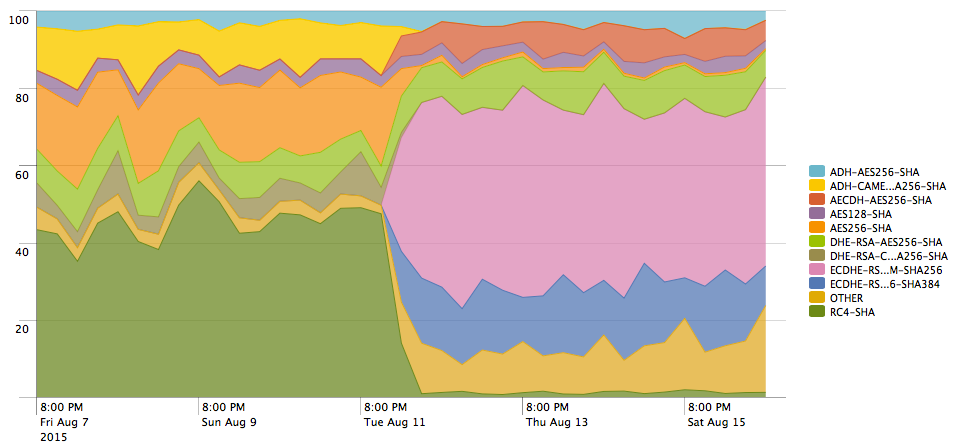
La montée de version de FreeBSD 9.x vers FreeBSD 10.1 m'a notamment permis de bénéficier d'une version d'OpenSSL plus récente, et supportant TLS 1.2. Ce changement n'est pas anodin. SSL est mort, TLS 1.0 suit le même chemin, il faut donc pouvoir utiliser TLS 1.2.
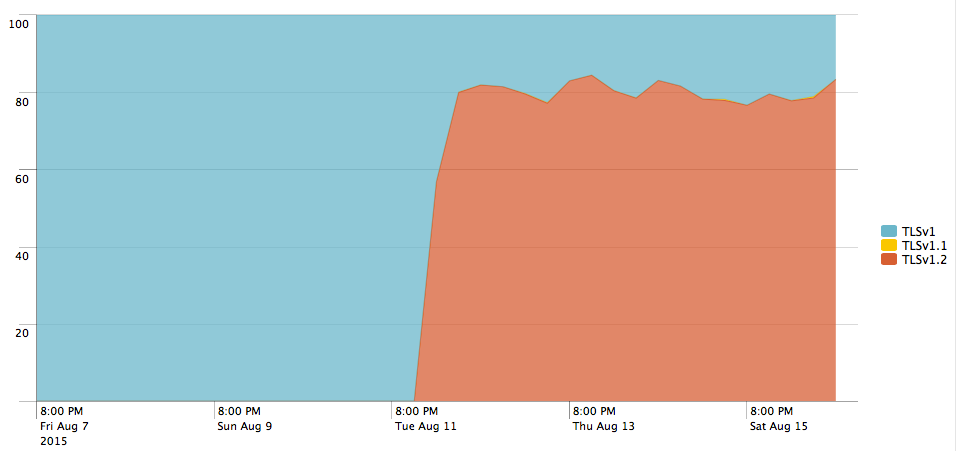
Voyons l'impact de cette mise à jour sur les échanges chiffrés avec les autres serveurs de messagerie (ici, uniquement les messages sortants) :

Évolution de la version de TLS dans les échanges suite à la mise à jour du système

Évolution de la version de TLS dans les échanges suite à la mise à jour du système

Évolution des algorithmes de chiffrement dans les échanges suite à la mise à jour du système

Évolution des algorithmes de chiffrement dans les échanges suite à la mise à jour du système

Cette rapide analyse ne porte que sur les échanges chiffrés : les échanges de mails avec les serveurs ne permettant pas le chiffrement TLS ne sont pas représentés. La passerelle de messagerie dont il est question ici fait tourner trois instances postfix en "postfix-multi", et voit transiter trois à cinq millions de messages par mois selon la période de l'année.

Related posts

ZFS primary cache is good

Last year I've written a post about ZFS primarycache setting, showing how it's not a good idea to mess with it. Here is a new example based on real world application.
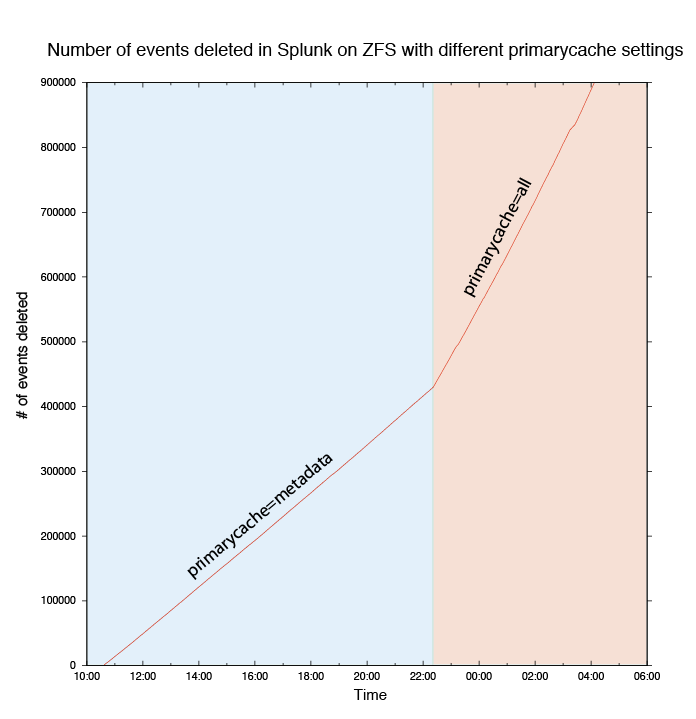
Recently, my server crashed, and at launch-time Splunk decided it was a good idea to re-index a huge apache log file. Apart from exploding my daily index quota, this misbehavior filed the index with duplicated data. Getting rid of 1284408 events in Splunk can be a little bit resource-intensive. I won't detail the Splunk part of the operation: I've ended up having 1285 batches of delete commands that I've launched with a simple for/do/done bash loop. After a while, I noticed that the process was slow and was making lots of disk IOs. Annoying. So I checked:

# zfs get primarycache zdata/splunk
NAME          PROPERTY      VALUE         SOURCE
zdata/splunk  primarycache  metadata      local

Uncool. This setting was set locally so that my toy (Splunk) would not harvest all ARC from the server, hurting production. For efficiency's sake, I've switched back the primary cache to all:

# zfs set primarycache=all zdata/splunk

Effect was almost instantaneous: ARC filled with Splunk data and disk IOs plummeted.

primarycache # of deletes per second
metadata 10.06
all 22.08

A x2.2 speedup on a very long operation (~20 hours here) is a very good argument in favor of primarycache=all for any ZFS user.

acceleration of a repetitive splunk operation thanks to ZFS primarycache setting

Acceleration of a repetitive splunk operation thanks to ZFS primarycache setting

Related posts

Giving up on Logstash

splunk-logoMore than six months away, I've put both Splunk and Logstash (plus ElasticSearch and Kibana) to trial. Since the beginning of my experiment, the difference between both products was pretty clear. I was hoping that ELK would be a nice solution to aggregate GBs of logs every day and more importantly to allow me and my team to dig into those logs.
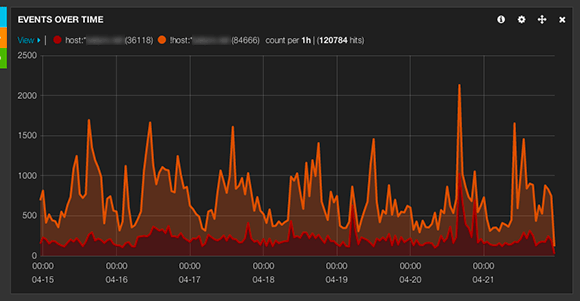
Unfortunately, ELK failed hard on me. Mostly because of ElasticSearch: java threads on the loose eating my CPU, weird issue where a restart would fail and ES would become unavailable, no real storage tiering solution, and so on.
ElastickSearch looks like a very nice developer playground to me. It's quite badly - if at all - documented on the sysadmin side, meaning if you're not a developer and don't have weeks to spend reading API documentation you will have a hard time figuring out how to simply use/tune the product.
Also, this data storage backend has absolutely no security features (at the time I was testing Logstash). Just imagine you put valuable data into a remotely available database/storage/whatever and you're told that you are the one that should create a security layer around the storage. Imagine a product like SMB, NFS, Oracle DB, Postgres, etc. with zero access control feature, no role. Anyone who can display a pie chart in Kibana can gain full control of your ElasticSearch cluster and wipe all your data.
Logstash too has important issues: almost every setting changes require an application restart. Writing grok pattern to extract data is an horrendous process, and a new pattern won't be applied on past data. Splunk on the other hand will happily use a brand new pattern to extract values from past logs, no restart required.
Logstash misses also pipes, functions, triggers… Search in Kibana is not great. The syntax is a bit weird and you can easily find nothing just because you've forgot to enclose your search string with quotes… or is it because you put those quotes? And of course there is this strange limit that prevent you from searching in more than seven or eight months of data…

I've tried, hard. I've registered to not-so-helpful official mailing lists for Logstash and ElasticSearch and simply reading them will show you how far those products are from "production approval". I've used it alongside with Splunk, it boils down to this statement: Kibana is pretty, you can put together many fancy pie charts, tables, maps and Splunk is useful, reliable, efficient.

Yes, I'm moving to Splunk, @work and @home. My own needs are very easily covered by a Free license, and we are buying a 10 GB/day license for our +350 servers/switches/firewalls.

You might say that Splunk is expensive. That's true. But it's way less expensive to me than paying a full time experienced Java developer to dive into ElasticSearch and Logstash for at least a year. Splunk has proper ACL that will allow me to abide by regulations, a good documentation, and a large community. It support natively storage tiering, too.

ELK is a fast moving beast, it grows, evolves, but it's way behind Splunk in terms of maturity. You can't just deploy ELK like you would do for MySQL, Apache, Postfix, Oracle DB, or Splunk. Lets wait few years to see how it gets better.

Related posts

Log aggregation and analysis: logstash

Logstash is free software, as in beer and speech. It can use many different backends, filters, etc. It comes packaged with Elasticsearch as a backend, and Kibana as user interface, by default. It makes a pleasant package to start with, as it's readily available for the user to start feeding logs. For your personal use, demo, or testing, the package is enough. But if you want to seriously use LS+ES you must have at least a dedicated Elasticsearch cluster.

apache-log-logstash-kibana

Starting with Logstash 1.4.0, the release is no longer a single jar file. It's now a fully browsable directory tree allowing you to manipulate files more easily.
ELK (Elasticsearch+Logstash+Kibana) is quite easy to deploy, but unlike Splunk, you'll have to install prerequisites yourself (Java, for example). No big deal. But the learning curve of ELK is harder. It took me almost a week to get some interesting results. I can blame the 1.4.0 release that is a bit buggy and won't start-up agent and web as advertised, the documentation that is light years away from what Splunk provides, the modularity of the solution that makes you wonder where to find support (is this an Elasticsearch question? a Kibana problem? some kind of grok issue?), etc.

Before going further with functionalities lets take a look at how ELK works. Logstash is the log aggregator tool. It's the piece of software in the middle of the mess, taking logs, filtering them, and sending them to any output you choose. Logstash takes logs through about 40 different "inputs" advertised in the documentation. You can think of file and syslog, of course, stdin, snmptrap, and so on. You'll also find some exotic inputs like twitter. That's in Logstash that you will spend the more time initially, tuning inputs, and tuning filters.
Elasticsearch is your storage backend. It's where Logstash outputs its filtered data. Elasticsearch can be very complex and needs a bit of work if you want to use it for production. It's more or less a clustered database system.
Kibana is the user interface to Elasticsearch. Kibana does not talk to your Logstash install. It will only talk to your Elasticsearch cluster. The thing I love the most about Kibana, is that it does not require any server-side processing. Kibana is entirely HTML and Javascript. You can even use a local copy of Kibana on your workstation to send request to a remote Elasticsearch cluster. This is important. Because Javascript is accessing your Elasticsearch server directly, it means that your Elasticsearch server has to be accessible from where you stand. This is not a good idea to let the world browse your indexed logs, or worse, write into your Elasticsearch cluster.

To avoid security complications the best move is to hide your ELK install behind an HTTP proxy. I'm using Apache, but anything else is fine (Nginx for example).
Knowing that 127.0.0.1:9292 is served by "logstash web" command, and 127.0.0.1:9200 is default Elasticsearch socket, your can use those Apache directives to get remote access based on IP addresses. Feel free to use any other access control policy.

ProxyPass /KI http://127.0.0.1:9292 
ProxyPassReverse /KI http://127.0.0.1:9292 
ProxyPass /ES http://127.0.0.1:9200 
ProxyPassReverse /ES http://127.0.0.1:9200 
<Location /KI>
	Order Allow,Deny
	Allow from YOUR-IP 127.0.0.1
</Location>
<Location /ES>
	Order Allow,Deny
	Allow from YOUR-IP 127.0.0.1
</Location>

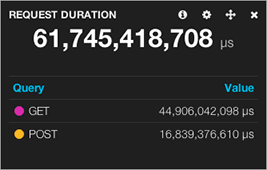
original data in µs, result in µs. Impossible to convert in hours (17h09)

original data in µs, result in µs. Impossible to convert in hours (17h09)

On the user side, ELK looks a lot like Splunk. Using queries to search through indexed logs is working the same, even if syntax is different. But Splunk allows you to pipe results into operators and math/stats/presentation functions… ELK is not really built for complex searches and the user cannot transform data with functions. The philosophy around Kibana is all about dashboards, with a very limited set of functions. You can build histograms, geoip maps, counters, compute some basic stats. You cannot make something as simple as rounding a number, or dynamically get a geolocation for an IP address. Everything has to be computed through Logstash filters, before reaching the Elasticsearch backend. So everything has to be computed before you know you need it.
Working with Logstash requires a lot of planing: breakdown of data with filters, process the result (geoip, calculation, normalization…), inject into Elasticsearch, taylor your request in Kibana, create the appropriate dashboard. And in the end, it won't allow you to mine your data as deep as I would want.
Kibana makes it very easy to save, store, share your dashboards/searches but is not very friendly with clear analysis needs.

Elasticsearch+Logstash+Kibana is an interesting product, for sure. It's also very badly documented. It looks like a free Splunk, but its only on the surface. I've been testing both for more than a month now, and I can testify they don't have a lot in common when it comes to use them on the field.

If you want pretty dashboards, and a nice web-based grep, go for ELK. It can also help a lot your command-line-illeterate colleagues. You know, those who don't know how to compute human-readable stats with a grep/awk one-liner and who gratefully rely on a dashboard printing a 61 billions microseconds figure.
If you want more than that, if you need some analytics, or even forensic, then odds are that ELK will let you down, and it makes me sad.

Related posts

Log aggregation and analysis: splunk

As soon as you have one server, you might be tempted to do some log analysis. That can be to get some metrics from your Apache logs, your spam filter, or whatever time-stamped data your server collects. You can easily find small tools, or even create a home-made solution to extract info from these files.
Now imagine you have 100, 200, or even thousands of servers. This home-made solution you've created no longer suits your needs.
Different powerful products exist, but I'll focus on two of them: Splunk on one side, Logstash+Elasticsearch+Kibana on the other side. This post is dedicated to Splunk. Logstash will come later.

Both softwares are tools. These are not all-in-one solution. Exactly like a spreadsheet software which is unable to calculate your taxes unless you design a specific table to do so, you must use the software to create value from your logs. Installing and feeding logs into the software is not the end of your work, it's the very beginning.

Splunk is a commercial product. It's incredibly powerful out of the box, and its documentation is very good. Every aspect of the software is covered in depth with numerous examples. It also has an official support. Unfortunately Splunk is very (very) expensive, and no official rates are available online. Hiding the cost of a software is often the promise you won't be able to afford it.
Splunk is well packaged and will run effortlessly on many common systems. At least for testing. Scaling up requires some work. I've been told that apparently, scaling up to more than few TB of daily logs can be difficult, but I don't have enough technical details to make a definitive statement about this.
Rest assured that Splunk is a very nice piece of software. It took me only an hour from the time I've installed it on a FreeBSD server, to the time I've produced a world map showing spam filter action breakdown by location:

amavis-geoloc

One hour. This is very short, almost insane. The map is fully interactive, and you can click any pie chart to display the table of values and the search request allowing you to create this table:

splunk-table

The query syntax is quite pleasant and almost natural. The search box is very helpful and suggests "Common next commands", or "Command history" alongside with documentation and example:

splunk-search

Splunk has some other killing features like users management and access control, assisted (almost automated) regex design for field extraction, or its plugin system. The Field extraction "wizard" is quite impressive, as it allows you to extract new fields out of already indexed logs, without writing any regex nor re-indexing your logs. You just browse your logs, paste samples of data you want to extract, and it builds the filter for you.
Transactions are also a pretty damn great feature: they make correlation of different events possible (login and logout, for example), so that you can track complex behaviors.

More importantly, Splunk appears to be simple enough so any sysadmin wants to use it and does not get rebutted by it's complexity. It's a matter of minute(s) to get, for example, the total CPU time involved in spam filtering last month (~573 hours here). Or if you want, the total CPU time your antispam wasted analyzing incoming emails from facebook (~14.5 hours). But it's definitively a very complex software, and you have to invest a great deal of time in order to get value (analytics designed for you) from what you paid for (the license fees).

I love Splunk, but it's way too expensive for me (and for the tax payers whose I use the money). So I'm currently giving Logstash a try and I'm quite happy about it.

Related posts