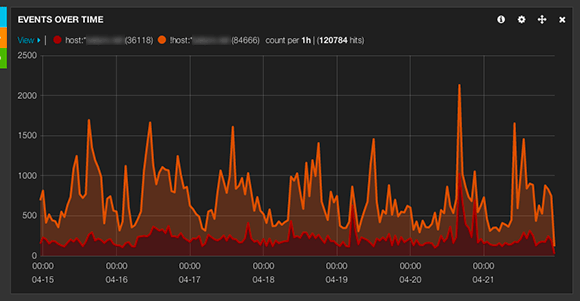
Logstash is free software, as in beer and speech. It can use many different backends, filters, etc. It comes packaged with Elasticsearch as a backend, and Kibana as user interface, by default. It makes a pleasant package to start with, as it's readily available for the user to start feeding logs. For your personal use, demo, or testing, the package is enough. But if you want to seriously use LS+ES you must have at least a dedicated Elasticsearch cluster.

Starting with Logstash 1.4.0, the release is no longer a single jar file. It's now a fully browsable directory tree allowing you to manipulate files more easily.
ELK (Elasticsearch+Logstash+Kibana) is quite easy to deploy, but unlike Splunk, you'll have to install prerequisites yourself (Java, for example). No big deal. But the learning curve of ELK is harder. It took me almost a week to get some interesting results. I can blame the 1.4.0 release that is a bit buggy and won't start-up agent and web as advertised, the documentation that is light years away from what Splunk provides, the modularity of the solution that makes you wonder where to find support (is this an Elasticsearch question? a Kibana problem? some kind of grok issue?), etc.
Before going further with functionalities lets take a look at how ELK works. Logstash is the log aggregator tool. It's the piece of software in the middle of the mess, taking logs, filtering them, and sending them to any output you choose. Logstash takes logs through about 40 different "inputs" advertised in the documentation. You can think of file and syslog, of course, stdin, snmptrap, and so on. You'll also find some exotic inputs like twitter. That's in Logstash that you will spend the more time initially, tuning inputs, and tuning filters.
Elasticsearch is your storage backend. It's where Logstash outputs its filtered data. Elasticsearch can be very complex and needs a bit of work if you want to use it for production. It's more or less a clustered database system.
Kibana is the user interface to Elasticsearch. Kibana does not talk to your Logstash install. It will only talk to your Elasticsearch cluster. The thing I love the most about Kibana, is that it does not require any server-side processing. Kibana is entirely HTML and Javascript. You can even use a local copy of Kibana on your workstation to send request to a remote Elasticsearch cluster. This is important. Because Javascript is accessing your Elasticsearch server directly, it means that your Elasticsearch server has to be accessible from where you stand. This is not a good idea to let the world browse your indexed logs, or worse, write into your Elasticsearch cluster.
To avoid security complications the best move is to hide your ELK install behind an HTTP proxy. I'm using Apache, but anything else is fine (Nginx for example).
Knowing that 127.0.0.1:9292 is served by "logstash web" command, and 127.0.0.1:9200 is default Elasticsearch socket, your can use those Apache directives to get remote access based on IP addresses. Feel free to use any other access control policy.
ProxyPass /KI http://127.0.0.1:9292
ProxyPassReverse /KI http://127.0.0.1:9292
ProxyPass /ES http://127.0.0.1:9200
ProxyPassReverse /ES http://127.0.0.1:9200
<Location /KI>
	Order Allow,Deny
	Allow from YOUR-IP 127.0.0.1
</Location>
<Location /ES>
	Order Allow,Deny
	Allow from YOUR-IP 127.0.0.1
</Location>

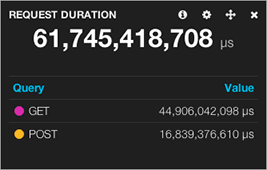
original data in µs, result in µs. Impossible to convert in hours (17h09)
Working with Logstash requires a lot of planing: breakdown of data with filters, process the result (geoip, calculation, normalization…), inject into Elasticsearch, taylor your request in Kibana, create the appropriate dashboard. And in the end, it won't allow you to mine your data as deep as I would want.
Kibana makes it very easy to save, store, share your dashboards/searches but is not very friendly with clear analysis needs.
Elasticsearch+Logstash+Kibana is an interesting product, for sure. It's also very badly documented. It looks like a free Splunk, but its only on the surface. I've been testing both for more than a month now, and I can testify they don't have a lot in common when it comes to use them on the field.
If you want pretty dashboards, and a nice web-based grep, go for ELK. It can also help a lot your command-line-illeterate colleagues. You know, those who don't know how to compute human-readable stats with a grep/awk one-liner and who gratefully rely on a dashboard printing a 61 billions microseconds figure.
If you want more than that, if you need some analytics, or even forensic, then odds are that ELK will let you down, and it makes me sad.