Log aggregation and analysis: splunk

As soon as you have one server, you might be tempted to do some log analysis. That can be to get some metrics from your Apache logs, your spam filter, or whatever time-stamped data your server collects. You can easily find small tools, or even create a home-made solution to extract info from these files.
Now imagine you have 100, 200, or even thousands of servers. This home-made solution you've created no longer suits your needs.
Different powerful products exist, but I'll focus on two of them: Splunk on one side, Logstash+Elasticsearch+Kibana on the other side. This post is dedicated to Splunk. Logstash will come later.

Both softwares are tools. These are not all-in-one solution. Exactly like a spreadsheet software which is unable to calculate your taxes unless you design a specific table to do so, you must use the software to create value from your logs. Installing and feeding logs into the software is not the end of your work, it's the very beginning.

Splunk is a commercial product. It's incredibly powerful out of the box, and its documentation is very good. Every aspect of the software is covered in depth with numerous examples. It also has an official support. Unfortunately Splunk is very (very) expensive, and no official rates are available online. Hiding the cost of a software is often the promise you won't be able to afford it.
Splunk is well packaged and will run effortlessly on many common systems. At least for testing. Scaling up requires some work. I've been told that apparently, scaling up to more than few TB of daily logs can be difficult, but I don't have enough technical details to make a definitive statement about this.
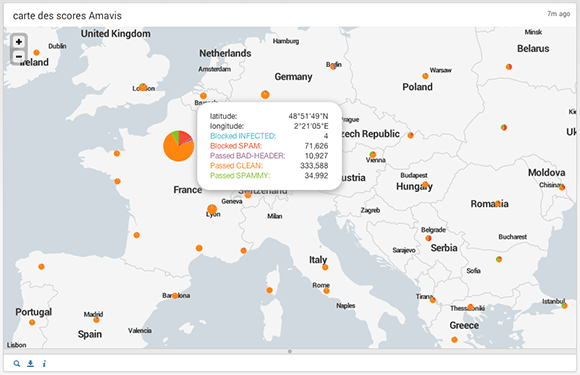
Rest assured that Splunk is a very nice piece of software. It took me only an hour from the time I've installed it on a FreeBSD server, to the time I've produced a world map showing spam filter action breakdown by location:

amavis-geoloc

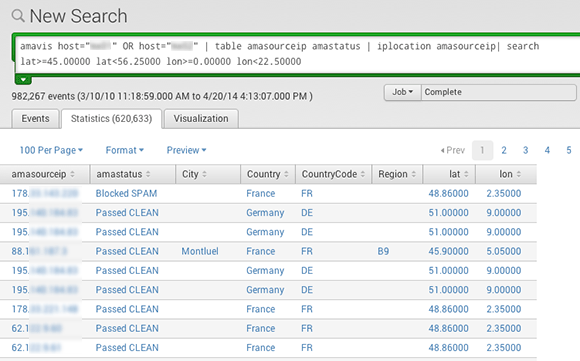
One hour. This is very short, almost insane. The map is fully interactive, and you can click any pie chart to display the table of values and the search request allowing you to create this table:

splunk-table

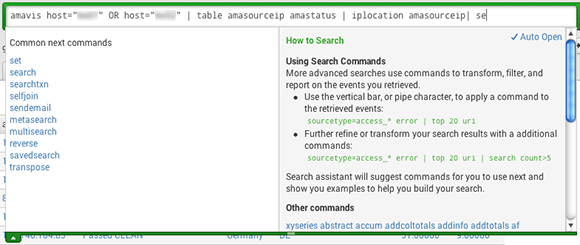
The query syntax is quite pleasant and almost natural. The search box is very helpful and suggests "Common next commands", or "Command history" alongside with documentation and example:

splunk-search

Splunk has some other killing features like users management and access control, assisted (almost automated) regex design for field extraction, or its plugin system. The Field extraction "wizard" is quite impressive, as it allows you to extract new fields out of already indexed logs, without writing any regex nor re-indexing your logs. You just browse your logs, paste samples of data you want to extract, and it builds the filter for you.
Transactions are also a pretty damn great feature: they make correlation of different events possible (login and logout, for example), so that you can track complex behaviors.

More importantly, Splunk appears to be simple enough so any sysadmin wants to use it and does not get rebutted by it's complexity. It's a matter of minute(s) to get, for example, the total CPU time involved in spam filtering last month (~573 hours here). Or if you want, the total CPU time your antispam wasted analyzing incoming emails from facebook (~14.5 hours). But it's definitively a very complex software, and you have to invest a great deal of time in order to get value (analytics designed for you) from what you paid for (the license fees).

I love Splunk, but it's way too expensive for me (and for the tax payers whose I use the money). So I'm currently giving Logstash a try and I'm quite happy about it.

Related posts

Dtrace on FreeBSD 9.2

FreeBSD logoAs of FreeBSD 9.2-RELEASE, Dtrace is enabled by default in the GENERIC kernel. We where already able to activate Dtrace, on earlier releases, but we would have to make a custom kernel. Not always what you want because it breaks binary updates.

Now that Dtrace is enabled (and updated) in FreeBSD, everyone can use it without the hassle of a custom kernel. You still have to load Dtrace's modules. Let's see how it works.

first you go root and try a Dtrace related command:

$ sudo -Es
Password:
# dtruss ls
dtrace: failed to initialize dtrace: DTrace device not available on system

Looks like Dtrace is not loaded:

# kldstat 
Id Refs Address            Size     Name
 1   23 0xffffffff80200000 15b93c0  kernel
 2    1 0xffffffff817ba000 23d078   zfs.ko
 3    2 0xffffffff819f8000 84e0     opensolaris.ko
 4    1 0xffffffff81a01000 4828     coretemp.ko
 5    1 0xffffffff81c12000 2bce     pflog.ko
 6    1 0xffffffff81c15000 3078d    pf.ko
 7    1 0xffffffff81c46000 57bcf    linux.ko
 8    1 0xffffffff81c9e000 3c3d     wlan_xauth.ko

lets find Dtrace related modules:

# ls /boot/kernel/dtrace*
/boot/kernel/dtrace.ko			/boot/kernel/dtrace_test.ko.symbols
/boot/kernel/dtrace.ko.symbols		/boot/kernel/dtraceall.ko
/boot/kernel/dtrace_test.ko		/boot/kernel/dtraceall.ko.symbols

/boot/kernel/dtraceall.ko looks like a winner.

# kldload dtraceall
# kldstat 
Id Refs Address            Size     Name
 1   59 0xffffffff80200000 15b93c0  kernel
 2    1 0xffffffff817ba000 23d078   zfs.ko
 3   16 0xffffffff819f8000 84e0     opensolaris.ko
 4    1 0xffffffff81a01000 4828     coretemp.ko
 5    1 0xffffffff81c12000 2bce     pflog.ko
 6    1 0xffffffff81c15000 3078d    pf.ko
 7    1 0xffffffff81c46000 57bcf    linux.ko
 8    1 0xffffffff81c9e000 3c3d     wlan_xauth.ko
 9    1 0xffffffff81ca2000 ba2      dtraceall.ko
10    1 0xffffffff81ca3000 4ed3     profile.ko
11    3 0xffffffff81ca8000 402c     cyclic.ko
12   12 0xffffffff81cad000 23dbaa   dtrace.ko
13    1 0xffffffff81eeb000 fb3d     systrace_freebsd32.ko
14    1 0xffffffff81efb000 109bd    systrace.ko
15    1 0xffffffff81f0c000 45bb     sdt.ko
16    1 0xffffffff81f11000 4926     lockstat.ko
17    1 0xffffffff81f16000 bf0b     fasttrap.ko
18    1 0xffffffff81f22000 6673     fbt.ko
19    1 0xffffffff81f29000 4eeb     dtnfsclient.ko
20    1 0xffffffff81f2e000 1dd92    nfsclient.ko
21    1 0xffffffff81f4c000 47c0     nfs_common.ko
22    1 0xffffffff81f51000 55f2     dtnfscl.ko
23    1 0xffffffff81f57000 45cd     dtmalloc.ko
24    1 0xffffffff81f5c000 44fc     dtio.ko

tadaaaam:

# dtruss ls
SYSCALL(args) 		 = return
mmap(0x0, 0x8000, 0x3)		 = 6418432 0
issetugid(0x0, 0x0, 0x0)		 = 0 0
lstat("/etc\0", 0x7FFFFFFFC3C0, 0x0)		 = 0 0
lstat("/etc/libmap.conf\0", 0x7FFFFFFFC3C0, 0x0)		 = 0 0
open("/etc/libmap.conf\0", 0x0, 0x81FA20)		 = 3 0
...

Happy debugging/tracing/auditing.

Related posts

Track mpm-itk problems with truss

Some background

I've some security needs on a shared hosting web server at work and I've ended up installing Apache-mpm-itk in place of my old vanilla Apache server. MPM-ITK is a piece of software (a set of patches in fact) you apply onto Apache source code to change it's natural behavior.
Out of the box, Apache spawns a handful of children httpd belonging to user www:www or whatever your config is using. Only the parent httpd belongs to root.
Hence, every single httpd must be able to read (and sometimes write) web site files. Now imagine you exploit a vulnerability into a php CMS, successfully injecting a php shell. Now through this php shell, you are www on the server, you can do everything www can, and it's bad, because you can even hack the other web sites of the server that have no known vulnerability.
With MPM-ITK, Apache spawns a handfull of master processes running as root, and accordingly to your config files, each httpd serving a particular virtual host or directory will switch from root to a user:group of your choice. So, one httpd process currently serving files from web site "foo" cannot access file from web site "bar": an attacker exploiting a vulnerability of one particular web site won't be able to hack every other web site on the server.

More background

That's a world you could dream of. In real world, that's not so simple. In particular, you'll start having troubles as soon as you make use of fancy features, especially when you fail to provide a dedicated virtual host per user.
On the shared server we host about 35 vhosts for 250 web sites, and we can't afford to provide every user with his dedicated vhost. The result is a given virtual host with a default value for the fallback user:group (say www:www), and each web site configured via Directory to use a different dedicated user.

When a client GET a resource (web page, img, css...) it generally keeps the connection opened with the httpd process. And it can happen that a resource linked from a web page sits into another directory, belonging to another user. The httpd process has already switched from root to user1 to serve the web page, it can't switch to user2 to serve the linked image from user2's directory. So Apache drops the connection, spawns a new httpd process, switches to user2, and serves the requested resource.
When it happens, you can read things like this into your Apache error log:

[warn] (itkmpm: pid=38130 uid=1002, gid=80) itk_post_perdir_config(): 
initgroups(www, 80): Operation not permitted
[warn] Couldn't set uid/gid/priority, closing connection.

That's perfectly "legal" behavior, don't be afraid, unless you read hundreds of new warning every minute.
If you host various web sites, belonging to various users, into the same vhost, you're likely to see many of these triggered by the /favicon.ico request.

Where it just breaks

When things are getting ugly is the moment a user tries to use one of your available mod_auth* variant to add some user authentication (think .htaccess). Remember, I host many web sites in a single vhost, each one into its own directory with its own user:group.

Suddenly every single visitor trying to access the protected directory or subdirectory is disconnected. Their http client reports something like this:

the server unexpectedly dropped the connection...

and nothing else is available. The error, server-side, is the same initgroups error as above, and it does not help at all. How would you solve this? truss is your friend.

Where I fix it

One thing I love about FreeBSD is the availability of many powerful tools out of the box. When I need to track down a strange software behavior, I feel very comfortable on FreeBSD (it doesn't mean I'm skilled). truss is one of my favorites, it's simple, straightforward and powerful.
What you need to use truss is the PID of your target. With Apache + MPM-ITK, processes won't stay around very long, and you can't tell which one you will connect to in advance. So the first step is to buy yourself some precious seconds so that you can get the PID of your target before the httpd process dies. Remember, it dies as soon as the .htaccess file is parsed. Being in production, I could not just kill everything and play alone with the server, so I choose another way. I've created a php script that would run for few seconds before ending. Server side, I've prepared a shell command that would install the .htaccess file I need to test, and start truss while grabbing the PID of my target. On FreeBSD, something like this should do the trick:

cd /path/to/user1/web/site
mv .htaccess_inactive .htaccess && truss -p $(ps auxw|awk '/^user1/ {print $2}')

First http GET request, the .htaccess file is not present, an httpd process switches from root to user1, starts serving the php script. I launch my command server-side: it puts .htaccess in place, gets the PID of my httpd process, and starts truss.
The php script ends and returns its result, client-side I refresh immediately (second GET request), so that I stay on the same httpd process. My client is disconnected as soon as the httpd process has parsed the .htaccess file. At this point, truss should already be dead. I've the complete trace of the event. The best is to read the trace backward from the point where httpd process issue an error about changing UID or GID:

01: setgroups(0x3,0x80a8ff000,0x14,0x3,0x566bc0,0x32008) 
    ERR#1 'Operation not permitted'
02: getgid()					 = 80 (0x50)
03: getuid()					 = 8872 (0x22a8)
04: getpid()					 = 52942 (0xcece)
05: gettimeofday({1364591872.453335 },0x0)		 = 0 (0x0)
06: write(2,"[Fri Mar 29 22:17:52 2013] [warn"...,142) = 142 (0x8e)
07: gettimeofday({1364591872.453583 },0x0)		 = 0 (0x0)
08: write(2,"[Fri Mar 29 22:17:52 2013] [warn"...,85) = 85 (0x55)
09: gettimeofday({1364591872.453814 },0x0)		 = 0 (0x0)
10: shutdown(51,SHUT_WR)				 = 0 (0x0)

Line 01 is the one I'm looking for: the httpd process is trying to change groups and fails, line 02 to 05 it's gathering data for the log entry, line 06 it's writing the error to the log file. 07 & 08: same deal for the second line of log.

From that point in time, moving up shows that it tried to access an out-of-directory resource, and that resource is an html error page! Of course, it makes sense, and it's an hard slap on the head (RTFM!).

01: stat("/user/user1/public_html/bench.php",{ 
    mode=-rw-r--r-- ,inode=4121,size=7427,blksize=7680 }) = 0 (0x0)
02: open("/user/user1/public_html/.htaccess",0x100000,00) = 53 (0x35)
03: fstat(53,{ mode=-rw-r--r-- ,inode=4225,size=128,blksize=4096 }) = 0 (0x0)
04: read(53,"AuthType Basic\nAuthName "Admin "...,4096) = 128 (0x80)
05: read(53,0x80a8efd88,4096)			 = 0 (0x0)
06: close(53)					 = 0 (0x0)
07: open("/user/user1/public_html/bench.php/.htaccess",0x100000,00) 
    ERR#20 'Not a directory'
08: getuid()					 = 8872 (0x22a8)
09: getgid()					 = 80 (0x50)
10: stat("/usr/local/www/apache22/error/HTTP_UNAUTHORIZED.html.var",{ 
    mode=-rw-r--r-- ,inode=454787,size=13557,blksize=16384 }) = 0 (0x0)
11: lstat("/usr/local/www/apache22/error/HTTP_UNAUTHORIZED.html.var",{ 
    mode=-rw-r--r-- ,inode=454787,size=13557,blksize=16384 }) = 0 (0x0)
12: getuid()					 = 8872 (0x22a8)
13: setgid(0x50,0x805d43d94,0x64,0x800644767,0x101010101010101,0x808080808080
    8080) = 0 (0x0)

line 13 shows the beginning of setgid process, and 10/11 shows the culprit. Up from here is the regular processing of the .htaccess file.

RTFM

When you use mod_auth* to present visitors with authentication, the server issues an error, and most of the time, this error is sent to the client with a dedicated header, and a dedicated html document (think "404"). When the error is about authentication (error 401), most clients hide the html part, and present the user with an authentication popup.
But the html part is almost always a physical file somewhere in the server directory tree. And it's this particular file the httpd process was trying to reach, issuing an initgroups command, and dying for not being allowed to switch users.
I've found in my Apache config the definition of ErrorDocument:

ErrorDocument 400 /error/HTTP_BAD_REQUEST.html.var
ErrorDocument 401 /error/HTTP_UNAUTHORIZED.html.var
ErrorDocument 403 /error/HTTP_FORBIDDEN.html.var
...

and replaced them all by a file-less equivalent, so Apache won't have any error file to read and will just send a plain ASCII error body (it saves bandwidth too):

ErrorDocument 400 "400 HTTP_BAD_REQUEST"
ErrorDocument 401 "401 HTTP_UNAUTHORIZED"
ErrorDocument 403 "403 HTTP_FORBIDDEN"
...

I've restarted Apache, and authentication from mod_auth* started to work as usual.
Same approach applies to almost any mpm-itk problem when it's related to a connection loss with Couldn't set uid/gid/priority, closing connection error log. You locate the resource that makes your server fail, and you find a way to fix the issue.
Related posts

Spamhaus’ ZEN blacklist efficiency

At work, I'm using Spamhaus' Zen blacklist for many years now. For a huge organization the amount of daily checks makes it impossible to rely on the free Spamhaus service. So we pay for a local copy of the blacklist, rsynched every 20 minutes. It allows faster check too. When you use Spamhaus' blacklists as a paid service, the question is: how can you rate your return on investment? In an attempt to answer this question, I've gathered 2 years and 9 months worth of mail server log files (12 GB bzip2) and extracted some data.

I use greylist, blacklist, whitelist, antispam/antivirus, and recipient-based filtering. So it make things quite complicated when I need clear statistics about what is going on. The MX server accepts around 1.3 million messages a month for internal delivery, but many more come knocking at the door.
The main purpose of blacklisting is to limit the amount of emails going thru expensive filters. Greylist and blacklist are cheap filters: they are fast, and they cost very few CPU, memory, and network resources. In comparison, antispam and antivirus filters are expensive: they are slow, and have a huge CPU, memory and network usage. I do before-queue content filtering. It means the MX server will scan for spam and virus before the email is accepted. So all the filtering process must take place during the SMTP session, and that's a pretty hard thing to do. To make sure that spam and virus filters are available for fast analysis, you must block as much as bad emails with cheap (and fast) filters.

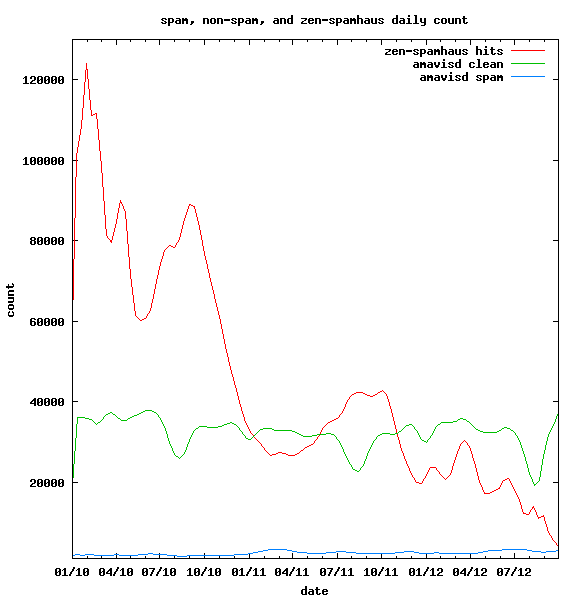
So here is the deal: use of paid RBL (Spamhaus' Zen, here) is only relevant if expensive filters cannot cope with the traffic. Below, the gnuplot output for MX log files between 20100101 and 20120928. It shows in red the number of hits in zen RBL, in green the number of emails coming out of Amavisd-new as "clean", and in blue the number of spam blocked by Amavisd-new.

2 years and 9 months of data: daily spam count in blue ("Blocked Spam" in amavisd-new logs), daily clean count ("Passed") in green, daily blacklist hits in red (blocked using zen.dnsbl-local in Postfix logs).

It shows, mainly, that hits in the blacklist have plummeted, when levels of spam and clean emails out of Amavisd-new are fairly constant. So while the blacklist is blocking at least 5 times less incoming SMTP transactions, the amount of emails reaching the antispam does not change. Spamhaus' zen blacklist efficiency is good (no increase in spam detection), but becomes less useful every day.

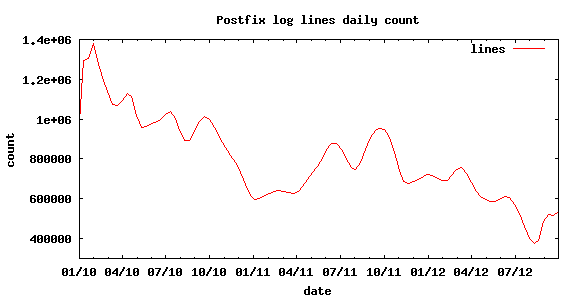
Below, the gnuplot output for the same time period showing the number of lines in Postfix logs :

total number of lines in postfix logs, daily basis

total number of lines in postfix logs, daily basis

It's good enough to stand for the evolution of the number of SMTP sessions and it's very similar to the curve of blacklist hits. Then, we can conclude that an external factor is responsible for the drop in incoming unwanted SMTP transactions. The war on botnets really took off in 2010, so may be we have an explanation here.

Lets go back to the main idea of this post: does zen blacklist worth its yearly fee? Based on my experience, yes it does, or at least, it did. From 2008 to 2011, it was clearly an asset. Before-queue content filtering would have been absolutely unusable. Reducing dramatically the load on the antivirus and antispam, zen RBL allowed me to handle about 1,300,000 clean email messages per month on a single MX server with b-qcf (on a 6 years old Apple XServe).
On 2012, zen blacklist still blocks a good daily amount of spam before it reaches the real antispam. But it's clear that if the trend continues, I will not renew the Spamhaus subscription on september 2013. At this rate, usefulness of this blacklist will not worth its cost by the end of 2012. Now that big vendors like Microsoft have embraced the war on botnets, I'm pretty confident that I won't need zen RBL any longer.

Related posts

Utiliser auditd sur Mac OS X et FreeBSD – 3

Cet article est la suite de Utiliser auditd sur Mac OS X et FreeBSD - 2

Exploiter les résultats de l'audit

Dans le premier article j'ai mentionné très succinctement une commande qui permet de lire les logs d'audit en temps réel. Et finalement la consultation de ces logs est sans doute la chose la plus intéressante. Personne n'a envie d'activer l'audit sur une machine pour le simple plaisir de remplir son disque dur. Tout ceci doit avoir une raison d'être : pouvoir ensuite (ou en temps réel) exploiter les logs d'auditd. Continue reading

Related posts

Utiliser auditd sur Mac OS X et FreeBSD – 2

Cet article est la suite de Utiliser auditd sur Mac OS X et FreeBSD - 1

Configuration : quid des utilisateurs comme www ?

J'expliquais précédemment que le système d'audit ne peut suivre un utilisateur que si ce dernier se connecte à la machine (par ssh par exemple), et que quelques soient les ruses utilisées (su, sudo...) c'est toujours l'UID réelle de l'utilisateur qui est suivie.

À cause de cela, il est totalement impossible de traquer des évènements appartenant à des utilisateurs qui ne peuvent pas se connecter au système. Ainsi, une ligne comme celle-ci dans audit_user ne permettra de traquer aucun évènement :

# pour freebsd remplacer _www par www
_www:fc,fd,ex:

Il serait pourtant très intéressant de savoir ce que fait Apache dans votre dos, parfois sous la direction de méchants pirates.
De nos jours, La plupart des serveurs utilisent des protocoles comme l'HTTP qui permettent aux utilisateurs d'accéder aux ressources sans être authentifiés au niveau du système. Les utilisateurs en question n'existent d'ailleurs pas au niveau du système. Néanmoins, les applications web permettent de faire énormément de choses via les langages comme le PHP, y compris d'interagir avec le système, en lançant des commandes, en créant des fichiers, etc.

Si on souhaite qu'auditd puisse contrôler les actions de www, il faut recourir à un artifice. Attention tout de même, ce qui suit est plus proche d'un hack que d'une méthode vraiment propre, et je ne peux pas garantir son fonctionnement correct dans un environnement de production.

En premier lieu il faut installer un programme spécifique, qui va permettre de forcer auditd à suivre les actions pour une UID donnée, sans que l'utilisateur correspondant ait besoin de se connecter à la machine.

curl -LO http://www.freebsd.org/~csjp/setaudit.c
cc -o setaudit -lbsm setaudit.c 

Cela vous donne, si tout se passe bien, le binaire setaudit, que l'on va utiliser sous cette forme :

setaudit -a UID_WWW -m FLAGS /programme/de/lancement/d/apache

Pour suivre les évènements d'exécution de commande sous respectivement FreeBSD et Mac OS X, cela donnera :

setaudit -a www -m ex /usr/local/etc/rc.d/apache22 restart
setaudit -a _www -m ex /usr/sbin/apachectl restart

Ainsi, toutes les commandes lancées par Apache (donc sous l'UID www) sont enregistrées par auditd.
Comme le masque des évènements (les flags de l'argument -m) décrit ce que l'on doit suivre, il est même inutile de renseigner le fichier audit_user.

Pour résumer :

  • Si vous souhaitez que l'audit suive les utilisateurs qui se connectent à la machine, vous pouvez régler les classes d'évènements qui seront soumises à l'audit pour l'ensemble des utilisateurs dans le fichier audit_control, et gérer les cas particuliers dans audit_user.
  • Si vous souhaitez que l'audit suive des UID "interne", pour traquer tout signe de compromission sur un serveur web, un serveur de mail, etc. il faudra recourir à setaudit pour activer l'audit au moment du lancement du service correspondant.
  • Faites attention à la liste de flags que vous choisissez. Le volume des logs d'audit peut grossir très rapidement.

Troisième partie de l'article ->

Related posts

Utiliser auditd sur Mac OS X et FreeBSD – 1

FreeBSD et les versions récentes de Mac OS X sont livrées avec un système d'audit intégré, dérivé du Basic Security Module de SUN, et disponible en logiciel libre sous le nom d'OpenBSM. Ce système d'audit se décompose en deux parties : un ensemble d'appels systèmes dédiés et de librairies d'un côté, et des logiciels "utilisateur" de l'autre. Sauf précision contraire, les explications présentées ici sont valables à la fois pour FreeBSD 7 et 8, et Mac OS X 10.6. Dans cette série d'articles je ne vais aborder que l'aspect "utilisateur" du système d'audit : comment l'activer, comment le configurer, comment exploiter les résultats.
Le système d'audit fourni par OpenBSM a pour but la surveillante des actions des utilisateurs. Un certain nombre d'évènements peuvent être mis sous surveillance, pour tout ou partie des utilisateurs. Quand le système d'exploitation détecte qu'un utilisateur sous surveillance génère un des évènements à surveiller, il averti le démon auditd qui se charge de reporter cet évènement dans un fichier de log. Continue reading

Related posts

Que nous apprend l’affaire « Gawker »

Comme je l'évoquais brièvement dans un précédent article, les serveurs de l'entreprise de média en ligne Gawker ont été piratés récemment, avec pour conséquence immédiate la diffusion au public des logins, emails, et mots de passe chiffrés de plus d'un million d'utilisateurs. Pour plusieurs centaines de milliers d'entre eux, les mots de passe avaient même été déchiffrés avant leur diffusion.
Pour quelqu'un comme moi les dessous de l'affaire sont croustillants, et les détails techniques sont même passionnants. Mais, plus important : tout le monde a une leçon à tirer de ce fiasco monumental.
Cette leçon, et non des moindres, est la suivante : dès l'instant où vous confiez un mot de passe à quelqu'un, ce mot de passe est vulnérable. Ça paraît tout bête comme ça, on se dit "mais oui, c'est sûr qu'en donnant mon mot de passe à mon voisin, alors il n'est plus secret". Non. Relisez bien la leçon, elle est à prendre au premier degré. Oubliez votre voisin, votre copine. Vous créez un compte chez Hotmail, vous choisissez un mot de passe pour pouvoir accéder plus tard à votre boîte mail, vous fournissez ce mot de passe à Hotmail. Ça y est, ce mot de passe n'est plus sûr. Un jour, c'est inévitable, c'est déjà arrivé, et ça arrivera à nouveau, des serveurs Hotmail seront piratés et votre mot de passe pourrait tomber dans les mains de quelqu'un.
L'affaire Gawker est bourrée d'exemples illustrants parfaitement ce principe. Les employés de chez Gawker s'échangeaient des mots de passe par chat, dont les archives des conversations ont été piratées. Le piratage des bases de données des sites de Gawker a montré que les mots de passe des utilisateurs n'étaient pas sécurisés : le chiffrement utilisé était archaïque et connu depuis des années pour être déficient, etc. etc.
Continue reading

Related posts