Bref, j’ai acheté un keylogger

Avant d'en venir au dispositif qui donne son titre à cet article il me semble important de donner un peu de contexte. Je cherche depuis plusieurs mois maintenant à me procurer un bon et beau clavier mécanique. "Beau" est bien évidemment un critère totalement subjectif, et si "bon" inclue des éléments objectifs comme la solidité, la fiabilité, il intègre lui-aussi des éléments totalement subjectifs.
Ce qu'il y a de merveilleux dans le monde des claviers mécaniques haut de gamme, c'est qu'il est presque possible de faire n'importe quoi : si aucune marque ne propose un clavier tout fait qui vous corresponde, il est presque toujours possible d'en construire un qui répondent à nombre de vos critères. Presque, parce que la France n'est pas tout à fait cœur de cible : trop peu de demande pour susciter une offre variée, me suis-je laissé dire. Aussi le critère "AZERTY" ou ISO-FR est sans doute un des plus difficiles à remplir. Vous trouverez tous les claviers ou jeux de touches en ANSI-US, une portion raisonnable en ISO-UK, ISO-NO, ISO-DE, mais presque aucuns en ISO-FR. Ceux que vous trouverez seront les plus grand public, souvent des claviers de gamer dans des formats réduits comme le populaire TKL ("ten key less"), qui comme son nom l'indique fait l'impasse sur pas mal de touches.
Vortex ViBE © vortexgear.tw
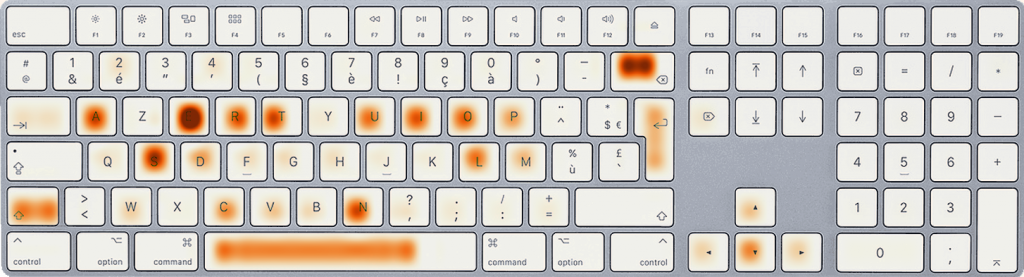
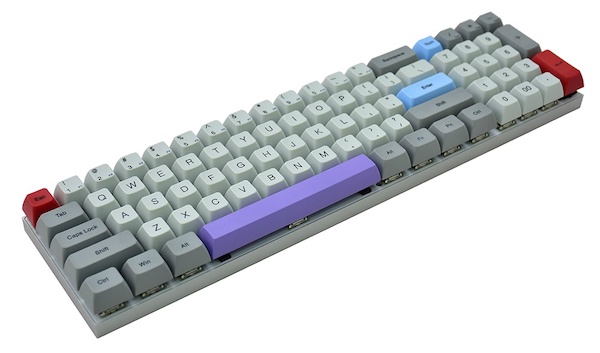
Après quelques mois d'étude du marché, de documentation sur les technologies, sur les capacités des claviers, sur les marques et leur réputation, de recherche d'un modèle qui réponde à mes besoins et à mes envies (surtout), j'ai fini par jeter mon dévolu sur deux modèles : le ViBE de Vortex Gear (photo ci-dessus), et le Tab 90M aussi chez Vortex Gear.
Bien sûr, je les veux en ISO-FR : je tape autant de texte que je code ou que je joue. J'ai besoin que mes accents et cédille soient accessibles sans contorsion. Et très honnêtement si je devais changer de disposition de touches j'irais sur un BEPO, pas sur l'archaïque ANSI-US.
J'ai plein d'autres critères que je ne détaille pas ici car ils n'ont aucun lien avec cette histoire de keylogger.
Comme on le remarque rapidement, le Vortex ViBE ne dispose pas de toutes les touches habituelles d'un clavier étendu : exit les flèches, page-down, page-up, etc. Toutes les touches entre le pavé numérique et le bloc de touches principal ont disparu. Par un jeu de combinaison de touches, il est possible d'utiliser le pavé numérique pour jouer le rôle des touches absentes. Dans mon quotidien, je fais un grand usage des flèches de navigation et du pavé numérique. En tout cas c'est ce qu'il me semble. J'utilise aussi les touches de fonctions (absentes sur le ViBE), et les touches "multimédia" du clavier étendu Apple qui est branché sur mes machines au travail et à la maison.
Je tenais donc à évaluer précisément l'usage que je fais de ces touches, histoire de ne pas prendre une trop grosse claque quand le fameux clavier arriverait. Et quoi de mieux pour savoir ce qu'on l'on tape toute la journée qu'un keylogger ? (réponse : rien).
La solution gratuite est assez facile à mettre en œuvre : trouver et installer sur mon poste un keylogger logiciel qui écrit dans un fichier texte tout ce qui passe par mon clavier. Mais cette solution est problématique à plusieurs égards. Notamment j'ai plusieurs machines. À la maison j'ai un OSX, un Windows et un FreeBSD, utilisés via un unique clavier physique au travers d'un switch USB. Il faudrait que je trouve une solution logicielle homogène à installer sur les trois systèmes. Au boulot et bien, juste non. Installer un keylogger logiciel qui pourrait exfiltrer à mon insu mes frappes clavier n'est réellement pas une bonne idée. Par ailleurs une solution logicielle attraperait aussi au vol ce qui sort de mes Yubikeys, et ça non plus ça ne me convient pas.
keygrapper © keelog.com
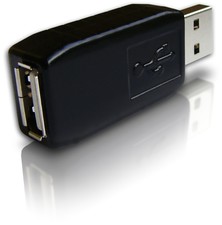
La solution matérielle qui stocke mes frappes clavier en son sein, sans rien faire sortir et qui s'affranchit totalement du système sur lequel est branché le clavier me semble donc la plus sûre à tout point de vue, et la plus adaptée à mes besoins. Bien évidement je me suis assuré que le dongle n'exfiltre aucune données via mes machines. L'exfiltration de données via un réseau hertzien est assez peu probable même si le dispositif semble assez grand pour héberger une SIM et l'électronique nécessaire pour tout renvoyer par SMS. Par ailleurs comme le dongle est branché sur un unique clavier, il m'est toujours possible de saisir des données sensibles via un autre clavier :)
Ceci posé, n'installez pas de keylogger chez vous sans savoir très exactement ce que vous faites et dans quoi vous mettez le doigt.

J'utilise le keylogger matériel depuis quelques dizaines de minutes, mais je vois déjà qu'il me faudra peut être tenter de le régler un peu finement : je tape trop vite pour lui, et pas mal de mots sont tronqués dans la capture. Cela a peut être aussi à voir avec le fait que c'est un modèle spécial supposé filtrer le trafic USB d'un clavier Apple. Les claviers Apple sont des hub USB, et sur le mien j'ai branché un casque/micro USB qui peut donc générer pas mal d'interférences au niveau du dongle qui connecte le clavier au switch USB. Quoi qu'il en soit ce n'est pas un drame puisque ce que je cherche à obtenir c'est une vue statistique de mes frappes, de mon utilisation du clavier.
Petit exemple de ce que cela donne :
[Sh]Parailleur comme le donge est branc sur un uniqu cver, il n[Bck]mest [Bck][Bck][Bck][Bck]e'est
Certains mots sont sévèrement amputés, mais l'esprit est là ! J'espère pouvoir obtenir des statistiques représentatives assez rapidement.

Bref, j'ai acheté un keylogger.

Related posts

Cracking passwords: testing PCFG password guess generator

Cracking passwords is a kind of e-sport, really. There's competition among amateurs and professionals "players", tools, gear. There are secrets, home-made recipes, software helpers, etc.
One of this software is PCFG password guess generator, for "Probabilistic Context-Free Grammar". I won't explain the concept of PCFG, some scientific literature exists you can read to discover all the math inside.
PCFG password guess generator comes as two main python programs: pcfg_trainer.py and pcfg_manager.py. Basic mechanism is the following:
- you feed pcfg_trainer.py with enough known passwords to generate comprehensive rules describing the grammar of known passwords, and supposedly unknown passwords too.
- you run pcfg_manager.py, using previously created grammar, to create millions of password candidates to feed into your favorite password cracker (John the Ripper, Hashcat…).

In order to measure PCFG password guess generator's efficiency I've made few tests. Here is my setup:

  • Huge password dump, 117205873 accounts with 61829207 unique Raw-SHA1 hashes;
  • John the Ripper, Bleeding Jumbo, downloaded 20160728, compiled on FreeBSD 10.x;
  • PCFG password guess generator, downloaded 20160801, launched with Python 3.x;

Here's my methodology:

Of these 61829207 hashes, about 35 millions are already cracked. I've extracted a random sample of 2 millions known passwords to feed the trainer. Then I've used pcfg_manager.py to create a 10 millions lines word list. I've also trimmed the famous Rockyou list to it's 10 millions first lines, to provide a known reference.

Finally, I've launched this shell script:

#!/bin/sh
for i in none wordlist jumbo; do
  ./john --wordlist=pcfg_crckr --rules=$i --session=pcfg_cracker-$i --pot=pcfg_cracker-$i.pot HugeDump
  ./john --wordlist=ry10m --rules=$i --session=ry10m-$i --pot=ry10m-$i.pot HugeDump
done

No forking, I'm running on one CPU core here. Each word list is tested three times, with no word mangling rules, with defaults JtR rules, and finally with Jumbo mangling rules.

Some results (number of cracked passwords):

Rules PCFG Rockyou
none 4409362 2774971
wordlist 5705502 5005889
Jumbo 21146209 22781889

That I can translate into efficiency, where efficiency is Cracked/WordlistLength as percentage:

Rules PCFG Rockyou
none 44.1% 27.7%
wordlist 57.1% 50.1%
Jumbo 211.5% 227.8%

It's quite interesting to see that the PCFG generated word list has a very good efficiency, compared to Rockyou list, when no rules are involved. That's to be expected, as PCFG password guess generator has been trained with a quite large sample of known passwords from the same dump I am attacking.
Also, the PCFG password guess generator creates candidates that are not very well suited for mangling, and only the jumbo set of rules achieves good results with this source. Rockyou on the other hand starts quite low with only 27.7% but jumps to 50.1% with common rules, and finally defeats PCFG when used with jumbo rules.

On the word list side, Rockyou is known and limited: it will never grow. But PCFG password guess generator looks like it can create an infinite list of candidates. Let see what happens when I create a list of +110 M candidates and feed them to JtR.

Rules PCFG Efficiency
none 9703571 8.8%
wordlist 10815243 9.8%

Efficiency plummets: only 9.7 M hashes cracked with a list of 110398024 candidates, and only 1.1 M more when the set of rules "wordlist" is applied. It's even less beneficial than with a list of 10 M candidates (+1.3 M with "wordlist" rules, compared to "none").

On the result side, both word list with jumbo rules yields to +21 M cracked passwords. But are those passwords identical, or different?

Rules Total unique cracked Yield
none 6013896 83.7%
wordlist 8184166 76.4%
Jumbo 26841735 61.1%
Yield = UniqueCracked / (PcfgCracked + RockyouCracked)

A high yield basically says that you should run both word lists into John. A yield of 50% means that all pwd cracked thanks to PCFG are identical to those cracked with the Rockyou list.

As a conclusion, I would say that the PCFG password guess generator is a very interesting tool, as it provides a way to generate valid candidates pretty easily. You probably still need a proper known passwords corpus to train it.
It's also very efficient with no rules at all, compared to the Rockyou list. That might make it a good tool for very slow hashes when you can't afford to try thousands of mangling rules on each candidate.

Some graphs to illustrate this post:

every john session on the same graph

every john session on the same graph

every session, zoomed on the first 2 minutes

every session, zoomed on the first 2 minutes

Rules "wordlist" on both lists of candidates

Rules "wordlist" on both lists of candidates

Rules "none", both lists of candidates

Rules "none", both lists of candidates

Related posts

Redis au secours de la performance du filtrage bayésien de SpamAssassin

Compte tenu des masses titanesques d'emails qu'un serveur peut être amené à traiter quotidiennement, l'optimisation des performances pour son logiciel de filtrage antispam est primordiale. C'est encore plus vrai si vous pratiquez le before queue content filtering.

Depuis plusieurs mois, vraisemblablement suite à une mise à jour d'une librairie ou d'un composant de l'antispam, j'ai constaté sur le SMTP authentifié @work un délai de traitement anormal dans certains cas. La durée normale pour le filtrage d'un message se situe entre 0 et 1 seconde, et pour une portion non-négligeable d'entre eux, cette durée passe à 30 secondes presque tout rond :

normal :                    anormal : 

elapsed: {                  elapsed: {
 Amavis: 0.059               Amavis: 0.267
 Decoding: 0.019             Decoding: 0.026
 Receiving: 0.002            Receiving: 0.002
 Sending: 0.027              Sending: 0.229
 SpamCheck: 0.156            SpamCheck: 30.113
 Total: 0.224                Total: 30.398
 VirusCheck: 0.003           VirusCheck: 0.008
}                           } 

Une recherche en mode debug m'a rapidement orienté vers un souci avec le filtrage bayésien :

SA dbg: locker: safe_lock: created /.../bayes.lock.foobar.19635
SA dbg: locker: safe_lock: trying to get lock on /.../bayes with 0 retries
SA dbg: locker: safe_lock: trying to get lock on /.../bayes with 1 retries
SA dbg: locker: safe_lock: trying to get lock on /.../bayes with 2 retries
SA dbg: locker: safe_lock: trying to get lock on /.../bayes with 3 retries
SA dbg: locker: safe_lock: trying to get lock on /.../bayes with 4 retries
SA dbg: locker: safe_lock: trying to get lock on /.../bayes with 5 retries
SA dbg: locker: safe_lock: trying to get lock on /.../bayes with 6 retries
SA dbg: locker: safe_lock: trying to get lock on /.../bayes with 7 retries
SA dbg: locker: safe_lock: trying to get lock on /.../bayes with 8 retries
SA dbg: locker: safe_lock: trying to get lock on /.../bayes with 9 retries

Ces 10 tentatives de prise de verrou ont souvent lieu 3 fois de suite, et chaque série dure 10 secondes : mon délai de 30 secondes est trouvé.
Le problème se trouvant du côté des fonctions d'accès à la base de données bayésienne, j'ai deux options : le résoudre ou le contourner. Le résoudre impliquerait probablement plusieurs journées d'analyse très fine et surtout de nombreux tests intrusifs sur une machine de production : pas envisageable.

J'ai donc pris le parti remplacer le stockage bayésien basique (Berkeley DB) par un stockage "haute performance" basé sur une base de données Redis.

Le changement est très simple à implémenter et totalement réversible. Le serveur Redis étant déjà installé sur la machine pour recueillir les logs détaillés d'Amavisd-new, il y a très peu de modifications à apporter pour y stocker les "seen" et les "token" de SpamAssassin.

Le support de Redis est inclus nativement dans Spamassassin depuis la version 3.4.0. Il suffit donc de placer les bons réglages et de recharger amavisd-new :

Dans le fichier /usr/local/etc/mail/spamassassin/local.cf on ajoute les lignes suivantes :

	bayes_store_module  Mail::SpamAssassin::BayesStore::Redis
	bayes_sql_dsn       server=127.0.0.1:6379;password=foo;database=3
	bayes_token_ttl 21d
	bayes_seen_ttl   8d

Et on recharge amavisd-new avec la commande sudo amavisd reload.

Il faut ensuite utiliser sa-learn pour faire apprendre à la nouvelle base vierge 200 messages de spam et 200 messages de ham, sans quoi la base bayésienne ne sera pas utilisée lors de l'analyse antispam.

Le gain de performance est immédiat : comme il s'agit d'une base de données NoSQL en mémoire, il n'y a pas de contrainte de verrou sur des fichiers, et la très forte concurrence des requêtes n'est plus un souci.

Entre la semaine 17 et la semaine 18 on constate la disparition quasi-totale des longs temps d'analyse, notamment dans la zone des 30 secondes (attention à l'échelle log) :

nbr_msg_pr_duree_antispam

Les trois bosses se situent respectivement autour de 10, 20 et 30 secondes. On remarque aussi que les performances de cette semaine 18 (avec Redis) sont meilleures que celles d'une semaine précédant l'arrivée du problème (bosse à 10 secondes) :

nbr_msg_pr_duree_antispam2

Une autre représentation des mêmes données montre de manière spectaculaire l'amélioration des temps d'analyse :

repartition_msg_pr_duree_pcent

Cette modification relativement simple améliore clairement le ressenti des utilisateurs du serveur SMTP (ie. qui ne passent pas par une interface "webmail"). Leur client de messagerie ne les fera plus attendre 30 secondes par envoi lors des périodes de forte affluence, et le filtrage en Before Queue est préservé. Le meilleur des deux mondes !

Related posts

Log aggregation and analysis: logstash

Logstash is free software, as in beer and speech. It can use many different backends, filters, etc. It comes packaged with Elasticsearch as a backend, and Kibana as user interface, by default. It makes a pleasant package to start with, as it's readily available for the user to start feeding logs. For your personal use, demo, or testing, the package is enough. But if you want to seriously use LS+ES you must have at least a dedicated Elasticsearch cluster.

apache-log-logstash-kibana

Starting with Logstash 1.4.0, the release is no longer a single jar file. It's now a fully browsable directory tree allowing you to manipulate files more easily.
ELK (Elasticsearch+Logstash+Kibana) is quite easy to deploy, but unlike Splunk, you'll have to install prerequisites yourself (Java, for example). No big deal. But the learning curve of ELK is harder. It took me almost a week to get some interesting results. I can blame the 1.4.0 release that is a bit buggy and won't start-up agent and web as advertised, the documentation that is light years away from what Splunk provides, the modularity of the solution that makes you wonder where to find support (is this an Elasticsearch question? a Kibana problem? some kind of grok issue?), etc.

Before going further with functionalities lets take a look at how ELK works. Logstash is the log aggregator tool. It's the piece of software in the middle of the mess, taking logs, filtering them, and sending them to any output you choose. Logstash takes logs through about 40 different "inputs" advertised in the documentation. You can think of file and syslog, of course, stdin, snmptrap, and so on. You'll also find some exotic inputs like twitter. That's in Logstash that you will spend the more time initially, tuning inputs, and tuning filters.
Elasticsearch is your storage backend. It's where Logstash outputs its filtered data. Elasticsearch can be very complex and needs a bit of work if you want to use it for production. It's more or less a clustered database system.
Kibana is the user interface to Elasticsearch. Kibana does not talk to your Logstash install. It will only talk to your Elasticsearch cluster. The thing I love the most about Kibana, is that it does not require any server-side processing. Kibana is entirely HTML and Javascript. You can even use a local copy of Kibana on your workstation to send request to a remote Elasticsearch cluster. This is important. Because Javascript is accessing your Elasticsearch server directly, it means that your Elasticsearch server has to be accessible from where you stand. This is not a good idea to let the world browse your indexed logs, or worse, write into your Elasticsearch cluster.

To avoid security complications the best move is to hide your ELK install behind an HTTP proxy. I'm using Apache, but anything else is fine (Nginx for example).
Knowing that 127.0.0.1:9292 is served by "logstash web" command, and 127.0.0.1:9200 is default Elasticsearch socket, your can use those Apache directives to get remote access based on IP addresses. Feel free to use any other access control policy.

ProxyPass /KI http://127.0.0.1:9292 
ProxyPassReverse /KI http://127.0.0.1:9292 
ProxyPass /ES http://127.0.0.1:9200 
ProxyPassReverse /ES http://127.0.0.1:9200 
<Location /KI>
	Order Allow,Deny
	Allow from YOUR-IP 127.0.0.1
</Location>
<Location /ES>
	Order Allow,Deny
	Allow from YOUR-IP 127.0.0.1
</Location>

original data in µs, result in µs. Impossible to convert in hours (17h09)

original data in µs, result in µs. Impossible to convert in hours (17h09)

On the user side, ELK looks a lot like Splunk. Using queries to search through indexed logs is working the same, even if syntax is different. But Splunk allows you to pipe results into operators and math/stats/presentation functions… ELK is not really built for complex searches and the user cannot transform data with functions. The philosophy around Kibana is all about dashboards, with a very limited set of functions. You can build histograms, geoip maps, counters, compute some basic stats. You cannot make something as simple as rounding a number, or dynamically get a geolocation for an IP address. Everything has to be computed through Logstash filters, before reaching the Elasticsearch backend. So everything has to be computed before you know you need it.
Working with Logstash requires a lot of planing: breakdown of data with filters, process the result (geoip, calculation, normalization…), inject into Elasticsearch, taylor your request in Kibana, create the appropriate dashboard. And in the end, it won't allow you to mine your data as deep as I would want.
Kibana makes it very easy to save, store, share your dashboards/searches but is not very friendly with clear analysis needs.

Elasticsearch+Logstash+Kibana is an interesting product, for sure. It's also very badly documented. It looks like a free Splunk, but its only on the surface. I've been testing both for more than a month now, and I can testify they don't have a lot in common when it comes to use them on the field.

If you want pretty dashboards, and a nice web-based grep, go for ELK. It can also help a lot your command-line-illeterate colleagues. You know, those who don't know how to compute human-readable stats with a grep/awk one-liner and who gratefully rely on a dashboard printing a 61 billions microseconds figure.
If you want more than that, if you need some analytics, or even forensic, then odds are that ELK will let you down, and it makes me sad.

Related posts

Log aggregation and analysis: splunk

As soon as you have one server, you might be tempted to do some log analysis. That can be to get some metrics from your Apache logs, your spam filter, or whatever time-stamped data your server collects. You can easily find small tools, or even create a home-made solution to extract info from these files.
Now imagine you have 100, 200, or even thousands of servers. This home-made solution you've created no longer suits your needs.
Different powerful products exist, but I'll focus on two of them: Splunk on one side, Logstash+Elasticsearch+Kibana on the other side. This post is dedicated to Splunk. Logstash will come later.

Both softwares are tools. These are not all-in-one solution. Exactly like a spreadsheet software which is unable to calculate your taxes unless you design a specific table to do so, you must use the software to create value from your logs. Installing and feeding logs into the software is not the end of your work, it's the very beginning.

Splunk is a commercial product. It's incredibly powerful out of the box, and its documentation is very good. Every aspect of the software is covered in depth with numerous examples. It also has an official support. Unfortunately Splunk is very (very) expensive, and no official rates are available online. Hiding the cost of a software is often the promise you won't be able to afford it.
Splunk is well packaged and will run effortlessly on many common systems. At least for testing. Scaling up requires some work. I've been told that apparently, scaling up to more than few TB of daily logs can be difficult, but I don't have enough technical details to make a definitive statement about this.
Rest assured that Splunk is a very nice piece of software. It took me only an hour from the time I've installed it on a FreeBSD server, to the time I've produced a world map showing spam filter action breakdown by location:

amavis-geoloc

One hour. This is very short, almost insane. The map is fully interactive, and you can click any pie chart to display the table of values and the search request allowing you to create this table:

splunk-table

The query syntax is quite pleasant and almost natural. The search box is very helpful and suggests "Common next commands", or "Command history" alongside with documentation and example:

splunk-search

Splunk has some other killing features like users management and access control, assisted (almost automated) regex design for field extraction, or its plugin system. The Field extraction "wizard" is quite impressive, as it allows you to extract new fields out of already indexed logs, without writing any regex nor re-indexing your logs. You just browse your logs, paste samples of data you want to extract, and it builds the filter for you.
Transactions are also a pretty damn great feature: they make correlation of different events possible (login and logout, for example), so that you can track complex behaviors.

More importantly, Splunk appears to be simple enough so any sysadmin wants to use it and does not get rebutted by it's complexity. It's a matter of minute(s) to get, for example, the total CPU time involved in spam filtering last month (~573 hours here). Or if you want, the total CPU time your antispam wasted analyzing incoming emails from facebook (~14.5 hours). But it's definitively a very complex software, and you have to invest a great deal of time in order to get value (analytics designed for you) from what you paid for (the license fees).

I love Splunk, but it's way too expensive for me (and for the tax payers whose I use the money). So I'm currently giving Logstash a try and I'm quite happy about it.

Related posts

Dtrace on FreeBSD 9.2

FreeBSD logoAs of FreeBSD 9.2-RELEASE, Dtrace is enabled by default in the GENERIC kernel. We where already able to activate Dtrace, on earlier releases, but we would have to make a custom kernel. Not always what you want because it breaks binary updates.

Now that Dtrace is enabled (and updated) in FreeBSD, everyone can use it without the hassle of a custom kernel. You still have to load Dtrace's modules. Let's see how it works.

first you go root and try a Dtrace related command:

$ sudo -Es
Password:
# dtruss ls
dtrace: failed to initialize dtrace: DTrace device not available on system

Looks like Dtrace is not loaded:

# kldstat 
Id Refs Address            Size     Name
 1   23 0xffffffff80200000 15b93c0  kernel
 2    1 0xffffffff817ba000 23d078   zfs.ko
 3    2 0xffffffff819f8000 84e0     opensolaris.ko
 4    1 0xffffffff81a01000 4828     coretemp.ko
 5    1 0xffffffff81c12000 2bce     pflog.ko
 6    1 0xffffffff81c15000 3078d    pf.ko
 7    1 0xffffffff81c46000 57bcf    linux.ko
 8    1 0xffffffff81c9e000 3c3d     wlan_xauth.ko

lets find Dtrace related modules:

# ls /boot/kernel/dtrace*
/boot/kernel/dtrace.ko			/boot/kernel/dtrace_test.ko.symbols
/boot/kernel/dtrace.ko.symbols		/boot/kernel/dtraceall.ko
/boot/kernel/dtrace_test.ko		/boot/kernel/dtraceall.ko.symbols

/boot/kernel/dtraceall.ko looks like a winner.

# kldload dtraceall
# kldstat 
Id Refs Address            Size     Name
 1   59 0xffffffff80200000 15b93c0  kernel
 2    1 0xffffffff817ba000 23d078   zfs.ko
 3   16 0xffffffff819f8000 84e0     opensolaris.ko
 4    1 0xffffffff81a01000 4828     coretemp.ko
 5    1 0xffffffff81c12000 2bce     pflog.ko
 6    1 0xffffffff81c15000 3078d    pf.ko
 7    1 0xffffffff81c46000 57bcf    linux.ko
 8    1 0xffffffff81c9e000 3c3d     wlan_xauth.ko
 9    1 0xffffffff81ca2000 ba2      dtraceall.ko
10    1 0xffffffff81ca3000 4ed3     profile.ko
11    3 0xffffffff81ca8000 402c     cyclic.ko
12   12 0xffffffff81cad000 23dbaa   dtrace.ko
13    1 0xffffffff81eeb000 fb3d     systrace_freebsd32.ko
14    1 0xffffffff81efb000 109bd    systrace.ko
15    1 0xffffffff81f0c000 45bb     sdt.ko
16    1 0xffffffff81f11000 4926     lockstat.ko
17    1 0xffffffff81f16000 bf0b     fasttrap.ko
18    1 0xffffffff81f22000 6673     fbt.ko
19    1 0xffffffff81f29000 4eeb     dtnfsclient.ko
20    1 0xffffffff81f2e000 1dd92    nfsclient.ko
21    1 0xffffffff81f4c000 47c0     nfs_common.ko
22    1 0xffffffff81f51000 55f2     dtnfscl.ko
23    1 0xffffffff81f57000 45cd     dtmalloc.ko
24    1 0xffffffff81f5c000 44fc     dtio.ko

tadaaaam:

# dtruss ls
SYSCALL(args) 		 = return
mmap(0x0, 0x8000, 0x3)		 = 6418432 0
issetugid(0x0, 0x0, 0x0)		 = 0 0
lstat("/etc\0", 0x7FFFFFFFC3C0, 0x0)		 = 0 0
lstat("/etc/libmap.conf\0", 0x7FFFFFFFC3C0, 0x0)		 = 0 0
open("/etc/libmap.conf\0", 0x0, 0x81FA20)		 = 3 0
...

Happy debugging/tracing/auditing.

Related posts

Track mpm-itk problems with truss

Some background

I've some security needs on a shared hosting web server at work and I've ended up installing Apache-mpm-itk in place of my old vanilla Apache server. MPM-ITK is a piece of software (a set of patches in fact) you apply onto Apache source code to change it's natural behavior.
Out of the box, Apache spawns a handful of children httpd belonging to user www:www or whatever your config is using. Only the parent httpd belongs to root.
Hence, every single httpd must be able to read (and sometimes write) web site files. Now imagine you exploit a vulnerability into a php CMS, successfully injecting a php shell. Now through this php shell, you are www on the server, you can do everything www can, and it's bad, because you can even hack the other web sites of the server that have no known vulnerability.
With MPM-ITK, Apache spawns a handfull of master processes running as root, and accordingly to your config files, each httpd serving a particular virtual host or directory will switch from root to a user:group of your choice. So, one httpd process currently serving files from web site "foo" cannot access file from web site "bar": an attacker exploiting a vulnerability of one particular web site won't be able to hack every other web site on the server.

More background

That's a world you could dream of. In real world, that's not so simple. In particular, you'll start having troubles as soon as you make use of fancy features, especially when you fail to provide a dedicated virtual host per user.
On the shared server we host about 35 vhosts for 250 web sites, and we can't afford to provide every user with his dedicated vhost. The result is a given virtual host with a default value for the fallback user:group (say www:www), and each web site configured via Directory to use a different dedicated user.

When a client GET a resource (web page, img, css...) it generally keeps the connection opened with the httpd process. And it can happen that a resource linked from a web page sits into another directory, belonging to another user. The httpd process has already switched from root to user1 to serve the web page, it can't switch to user2 to serve the linked image from user2's directory. So Apache drops the connection, spawns a new httpd process, switches to user2, and serves the requested resource.
When it happens, you can read things like this into your Apache error log:

[warn] (itkmpm: pid=38130 uid=1002, gid=80) itk_post_perdir_config(): 
initgroups(www, 80): Operation not permitted
[warn] Couldn't set uid/gid/priority, closing connection.

That's perfectly "legal" behavior, don't be afraid, unless you read hundreds of new warning every minute.
If you host various web sites, belonging to various users, into the same vhost, you're likely to see many of these triggered by the /favicon.ico request.

Where it just breaks

When things are getting ugly is the moment a user tries to use one of your available mod_auth* variant to add some user authentication (think .htaccess). Remember, I host many web sites in a single vhost, each one into its own directory with its own user:group.

Suddenly every single visitor trying to access the protected directory or subdirectory is disconnected. Their http client reports something like this:

the server unexpectedly dropped the connection...

and nothing else is available. The error, server-side, is the same initgroups error as above, and it does not help at all. How would you solve this? truss is your friend.

Where I fix it

One thing I love about FreeBSD is the availability of many powerful tools out of the box. When I need to track down a strange software behavior, I feel very comfortable on FreeBSD (it doesn't mean I'm skilled). truss is one of my favorites, it's simple, straightforward and powerful.
What you need to use truss is the PID of your target. With Apache + MPM-ITK, processes won't stay around very long, and you can't tell which one you will connect to in advance. So the first step is to buy yourself some precious seconds so that you can get the PID of your target before the httpd process dies. Remember, it dies as soon as the .htaccess file is parsed. Being in production, I could not just kill everything and play alone with the server, so I choose another way. I've created a php script that would run for few seconds before ending. Server side, I've prepared a shell command that would install the .htaccess file I need to test, and start truss while grabbing the PID of my target. On FreeBSD, something like this should do the trick:

cd /path/to/user1/web/site
mv .htaccess_inactive .htaccess && truss -p $(ps auxw|awk '/^user1/ {print $2}')

First http GET request, the .htaccess file is not present, an httpd process switches from root to user1, starts serving the php script. I launch my command server-side: it puts .htaccess in place, gets the PID of my httpd process, and starts truss.
The php script ends and returns its result, client-side I refresh immediately (second GET request), so that I stay on the same httpd process. My client is disconnected as soon as the httpd process has parsed the .htaccess file. At this point, truss should already be dead. I've the complete trace of the event. The best is to read the trace backward from the point where httpd process issue an error about changing UID or GID:

01: setgroups(0x3,0x80a8ff000,0x14,0x3,0x566bc0,0x32008) 
    ERR#1 'Operation not permitted'
02: getgid()					 = 80 (0x50)
03: getuid()					 = 8872 (0x22a8)
04: getpid()					 = 52942 (0xcece)
05: gettimeofday({1364591872.453335 },0x0)		 = 0 (0x0)
06: write(2,"[Fri Mar 29 22:17:52 2013] [warn"...,142) = 142 (0x8e)
07: gettimeofday({1364591872.453583 },0x0)		 = 0 (0x0)
08: write(2,"[Fri Mar 29 22:17:52 2013] [warn"...,85) = 85 (0x55)
09: gettimeofday({1364591872.453814 },0x0)		 = 0 (0x0)
10: shutdown(51,SHUT_WR)				 = 0 (0x0)

Line 01 is the one I'm looking for: the httpd process is trying to change groups and fails, line 02 to 05 it's gathering data for the log entry, line 06 it's writing the error to the log file. 07 & 08: same deal for the second line of log.

From that point in time, moving up shows that it tried to access an out-of-directory resource, and that resource is an html error page! Of course, it makes sense, and it's an hard slap on the head (RTFM!).

01: stat("/user/user1/public_html/bench.php",{ 
    mode=-rw-r--r-- ,inode=4121,size=7427,blksize=7680 }) = 0 (0x0)
02: open("/user/user1/public_html/.htaccess",0x100000,00) = 53 (0x35)
03: fstat(53,{ mode=-rw-r--r-- ,inode=4225,size=128,blksize=4096 }) = 0 (0x0)
04: read(53,"AuthType Basic\nAuthName "Admin "...,4096) = 128 (0x80)
05: read(53,0x80a8efd88,4096)			 = 0 (0x0)
06: close(53)					 = 0 (0x0)
07: open("/user/user1/public_html/bench.php/.htaccess",0x100000,00) 
    ERR#20 'Not a directory'
08: getuid()					 = 8872 (0x22a8)
09: getgid()					 = 80 (0x50)
10: stat("/usr/local/www/apache22/error/HTTP_UNAUTHORIZED.html.var",{ 
    mode=-rw-r--r-- ,inode=454787,size=13557,blksize=16384 }) = 0 (0x0)
11: lstat("/usr/local/www/apache22/error/HTTP_UNAUTHORIZED.html.var",{ 
    mode=-rw-r--r-- ,inode=454787,size=13557,blksize=16384 }) = 0 (0x0)
12: getuid()					 = 8872 (0x22a8)
13: setgid(0x50,0x805d43d94,0x64,0x800644767,0x101010101010101,0x808080808080
    8080) = 0 (0x0)

line 13 shows the beginning of setgid process, and 10/11 shows the culprit. Up from here is the regular processing of the .htaccess file.

RTFM

When you use mod_auth* to present visitors with authentication, the server issues an error, and most of the time, this error is sent to the client with a dedicated header, and a dedicated html document (think "404"). When the error is about authentication (error 401), most clients hide the html part, and present the user with an authentication popup.
But the html part is almost always a physical file somewhere in the server directory tree. And it's this particular file the httpd process was trying to reach, issuing an initgroups command, and dying for not being allowed to switch users.
I've found in my Apache config the definition of ErrorDocument:

ErrorDocument 400 /error/HTTP_BAD_REQUEST.html.var
ErrorDocument 401 /error/HTTP_UNAUTHORIZED.html.var
ErrorDocument 403 /error/HTTP_FORBIDDEN.html.var
...

and replaced them all by a file-less equivalent, so Apache won't have any error file to read and will just send a plain ASCII error body (it saves bandwidth too):

ErrorDocument 400 "400 HTTP_BAD_REQUEST"
ErrorDocument 401 "401 HTTP_UNAUTHORIZED"
ErrorDocument 403 "403 HTTP_FORBIDDEN"
...

I've restarted Apache, and authentication from mod_auth* started to work as usual.
Same approach applies to almost any mpm-itk problem when it's related to a connection loss with Couldn't set uid/gid/priority, closing connection error log. You locate the resource that makes your server fail, and you find a way to fix the issue.

Related posts

Spamhaus’ ZEN blacklist efficiency

At work, I'm using Spamhaus' Zen blacklist for many years now. For a huge organization the amount of daily checks makes it impossible to rely on the free Spamhaus service. So we pay for a local copy of the blacklist, rsynched every 20 minutes. It allows faster check too. When you use Spamhaus' blacklists as a paid service, the question is: how can you rate your return on investment? In an attempt to answer this question, I've gathered 2 years and 9 months worth of mail server log files (12 GB bzip2) and extracted some data.

I use greylist, blacklist, whitelist, antispam/antivirus, and recipient-based filtering. So it make things quite complicated when I need clear statistics about what is going on. The MX server accepts around 1.3 million messages a month for internal delivery, but many more come knocking at the door.
The main purpose of blacklisting is to limit the amount of emails going thru expensive filters. Greylist and blacklist are cheap filters: they are fast, and they cost very few CPU, memory, and network resources. In comparison, antispam and antivirus filters are expensive: they are slow, and have a huge CPU, memory and network usage. I do before-queue content filtering. It means the MX server will scan for spam and virus before the email is accepted. So all the filtering process must take place during the SMTP session, and that's a pretty hard thing to do. To make sure that spam and virus filters are available for fast analysis, you must block as much as bad emails with cheap (and fast) filters.

So here is the deal: use of paid RBL (Spamhaus' Zen, here) is only relevant if expensive filters cannot cope with the traffic. Below, the gnuplot output for MX log files between 20100101 and 20120928. It shows in red the number of hits in zen RBL, in green the number of emails coming out of Amavisd-new as "clean", and in blue the number of spam blocked by Amavisd-new.

2 years and 9 months of data: daily spam count in blue ("Blocked Spam" in amavisd-new logs), daily clean count ("Passed") in green, daily blacklist hits in red (blocked using zen.dnsbl-local in Postfix logs).

It shows, mainly, that hits in the blacklist have plummeted, when levels of spam and clean emails out of Amavisd-new are fairly constant. So while the blacklist is blocking at least 5 times less incoming SMTP transactions, the amount of emails reaching the antispam does not change. Spamhaus' zen blacklist efficiency is good (no increase in spam detection), but becomes less useful every day.

Below, the gnuplot output for the same time period showing the number of lines in Postfix logs :

total number of lines in postfix logs, daily basis

total number of lines in postfix logs, daily basis

It's good enough to stand for the evolution of the number of SMTP sessions and it's very similar to the curve of blacklist hits. Then, we can conclude that an external factor is responsible for the drop in incoming unwanted SMTP transactions. The war on botnets really took off in 2010, so may be we have an explanation here.

Lets go back to the main idea of this post: does zen blacklist worth its yearly fee? Based on my experience, yes it does, or at least, it did. From 2008 to 2011, it was clearly an asset. Before-queue content filtering would have been absolutely unusable. Reducing dramatically the load on the antivirus and antispam, zen RBL allowed me to handle about 1,300,000 clean email messages per month on a single MX server with b-qcf (on a 6 years old Apple XServe).
On 2012, zen blacklist still blocks a good daily amount of spam before it reaches the real antispam. But it's clear that if the trend continues, I will not renew the Spamhaus subscription on september 2013. At this rate, usefulness of this blacklist will not worth its cost by the end of 2012. Now that big vendors like Microsoft have embraced the war on botnets, I'm pretty confident that I won't need zen RBL any longer.

Related posts