 Four years ago I've started a journey in workstation virtualization. My goal at the time was to try and escape Apple's ecosystem as it was moving steadily toward closedness (and iOS-ness). I also though back then that it would allow me to pause planned obsolescence by isolating the hardware from the software.
I've been very wrong.
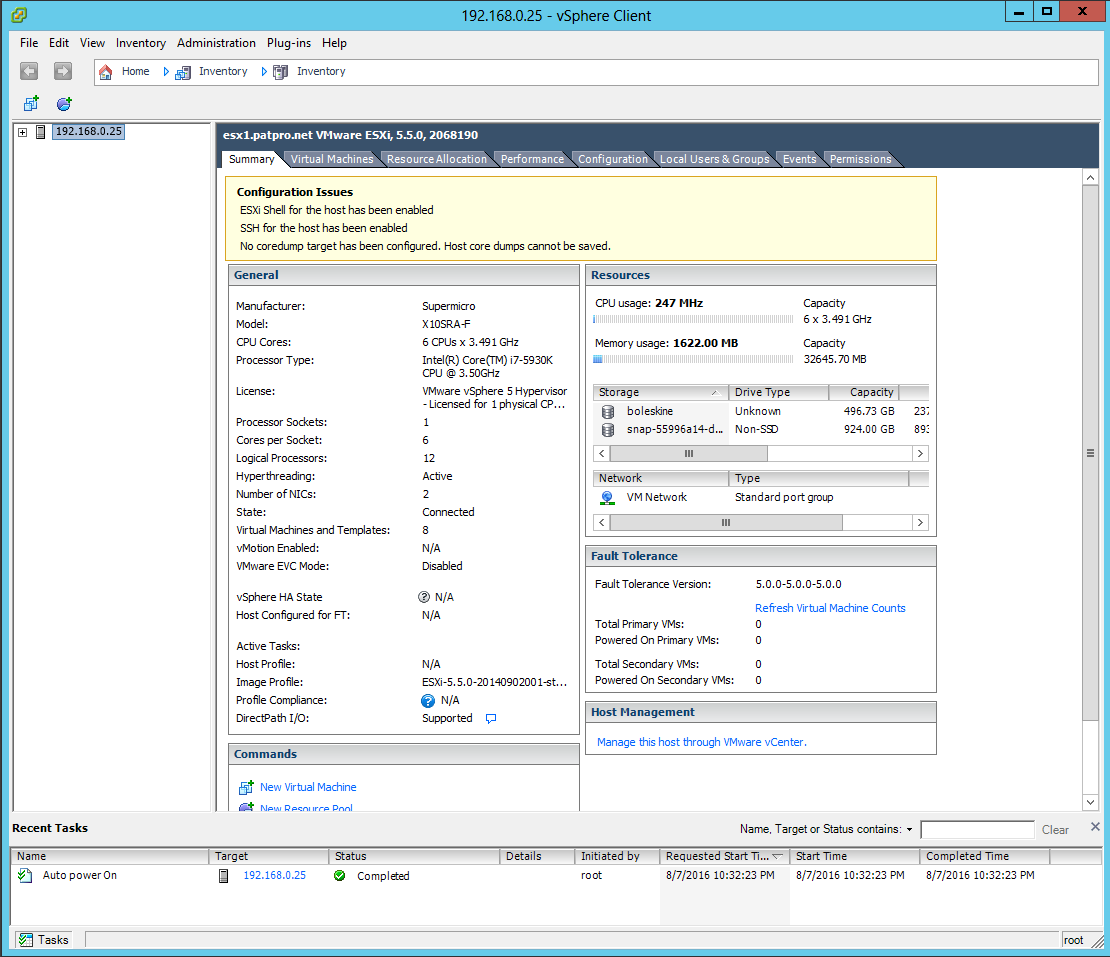
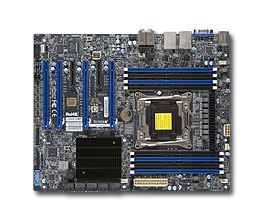 My ESXi workstation was built with power, scalability and silence in mind. And it had all this for a long time. But about 1.5 year ago I've started to notice the hum of one of its graphics card. Recently this hum turned into an unpleasant high pitched sound under load. The fans were aging and I needed a solution. Problem is, one just can't choose any graphics card off the shelf and put it into an ESXi server. It requires a compatibility study: card vs motherboard, vs PSU, vs ESXi, vs VM Operating system. If you happened to need an ESXi upgrade (from 5.x to 6.x for example) in order to use a new graphics card then you need to study the compatibility of this new ESXi with your other graphics cards, your other VM OSes, etc.
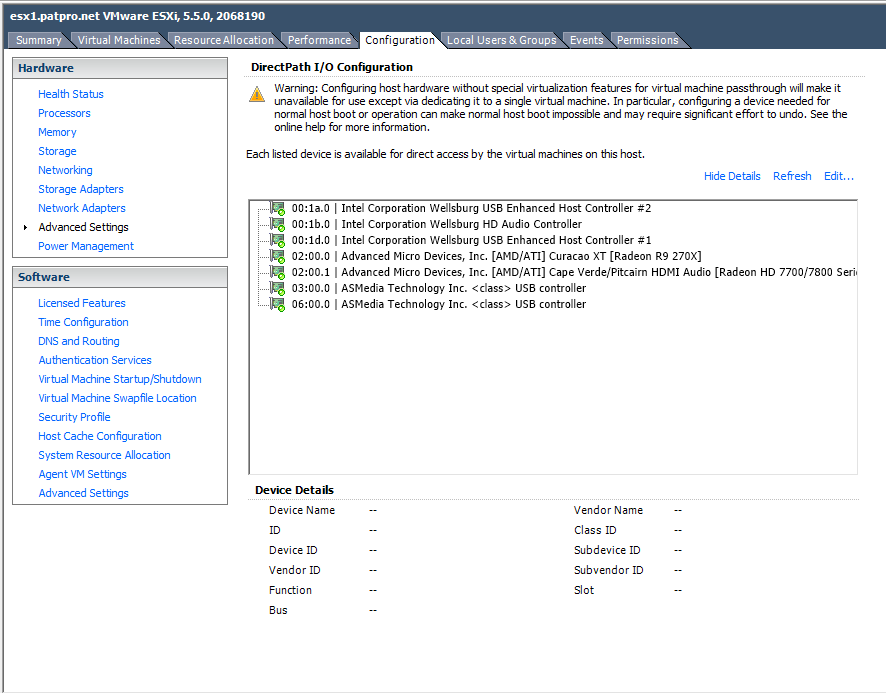
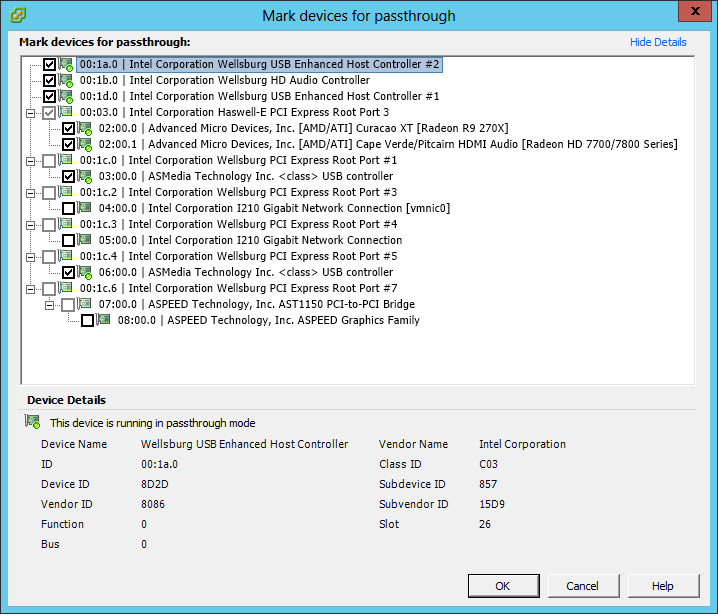
And this is where I was stuck. My main workstation was a macOS VM using an old Mac Pro Radeon that would not work on ESXi 6.x. All things considered, every single upgrade path was doomed to failure unless I could find a current graphics card, silent, that would work on ESXi 5.x and get accepted by the Windows 10 guest via PCI passthrough. I've found one: the Sapphire Radeon RX 590 Nitro+. Worked great at first. Very nice benchmark and remarquable silence. But after less than an hour I noticed that HDDs inside the ESXi were missing, gone. In fact, under GPU load the motherboard would lose its HDDs. I don't know for sure but it could have been a power problem, even though the high quality PSU was rated for 1000W. Anyway, guess what: ESXi does not like losing its boot HDD or a datastore. So I've sent the graphics card back and got a refund.
Second problem: I was stuck with a decent but old macOS release (10.11, aka El Capitan). No more updates, no more security patches. Upgrading the OS was also a complex operation with compatibility problems with the old ESXi release and with the older Mac Pro Radeon. I've tried a few things but it always ended with a no-go.
Later this year, I've given a try to another Radeon GPU, less power-hungry but it yielded to other passthrough and VM malfunctions. This time I choose to keep the new GPU as an incentive to deal with the whole ESXi mess.
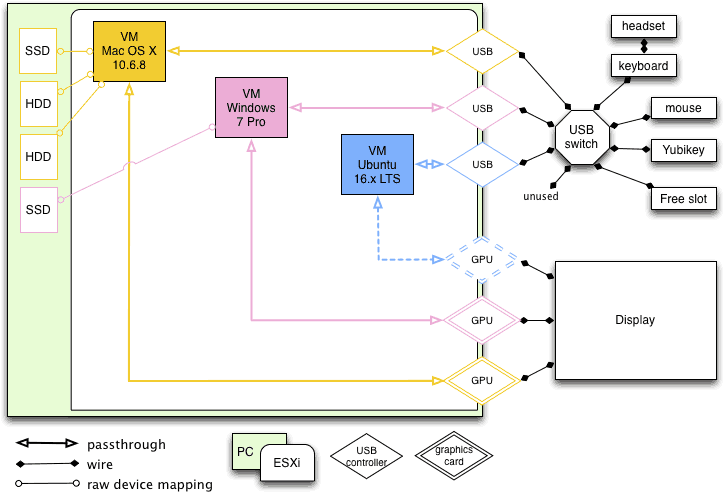
So basically, the situation was: very nice multi-head setup, powerful, scalable (room for more storage, more RAM, more PCI) but stuck in the past with a 5 years old macOS using a 10 years old Mac Pro graphics card in passthrough on top of a 5 years old ESXi release, the Windows 10 GPU becoming noisy, and nowhere to go from there.
I went through the 5 stages of grief and accepted that this path was a dead-end. No more workstation virtualization, no more complex PCI passthrough, I've had enough. Few weeks ago I've started to plan my escape: I need a silent Mac with decent power and storage (photo editing), I need a silent and relatively powerful Windows 10 gaming PC, I need an always on, tiny virtualization box for everything else (splunk server, linux and FreeBSD experiments, etc.). It was supposed to be a slow migration process, maintaining both infrastructures in parallel for some weeks and allowing perfect testing and switching.
Full disclosure: it was not.
I've created the Mac first, mostly because the PC case ordered was not delivered yet. Using a NUC10i7 I've followed online instructions and installed my very first Hackintosh. It worked almost immediately. Quite happy about the result, I've launched the migration assistant on my macOS VM and on my Hackintosh and injected about 430 Go of digital life into the little black box. Good enough for a test, I was quite sure I would wipe everything and rebuild a clean system later.
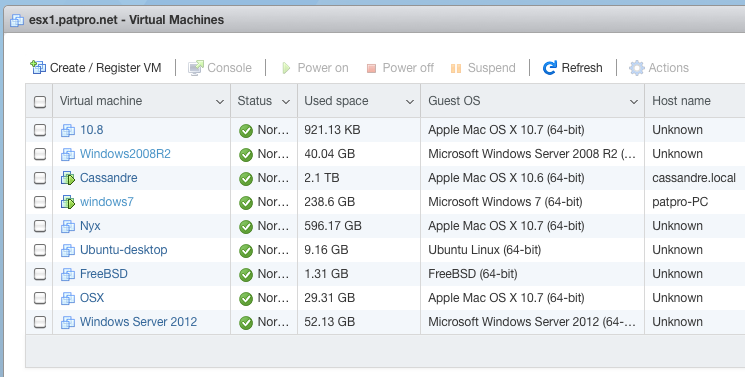
Few days later I started to build the PC. I was supposed to reclaim a not-so-useful SSD from the ESXi workstation to use as the main bare metal PC storage. I've made sure nothing was on the SSD, I've shutdown ESXi and removed the SSD and it's SATA cable. I've also removed another SSD+cable that was not used (failed migration attempt to ESXi 6.x and test for Proxmox). I've restarted ESXi just to find out a third SSD has disappeared: a very useful datastore is missing, 7 or 8 VM are impacted, partially or totally. The macOS VM is dead, main VMDK is missing (everything else is present, even its Time Machine VMDK), the Splunk VM is gone with +60 Go of logs, Ubuntu server is gone, some FreeBSD are gone too, etc.
Few reboots later, I extract the faulty SSD and start testing: different cable, different port, different PC. Nothing works and the SSD is not even detected by the BIOS (on both PCs).
This is a good incentive for a fast migration to bare metal PCs.
Fortunately:
- a spare macOS 10.11 VM, blank but fully functional, is waiting for me on an NFS datastore (backed by FreeBSD and ZFS).
- the Time machine VMDK of my macOS VM workstation is OK
- my Hackintosh is ready even though its data is about a week old
- the Windows 10 VM workstation is fully functional
So I've plugged the Time machine disk into the spare macOS VM, booted it, and launched Disk Utility to create a compressed image of the Time machine disk. Then I've copied this 350 Go dmg file on the Hackintosh SSD, after what I've mounted this image and copied the week worth of out-of-sync data to my new macOS bare metal workstation (mostly Lightroom related files and pictures).
I've plugged the reclaimed SSD into the new PC and installed Windows 10, configured everything I need, started Steam and downloaded my usual games.
Last but not least, I've shutdown the ESXi workstation, for good this time, unplugged everything (a real mess), cleaned up a bit, installed the new, way smaller, gaming PC, plugged everything.
 Unfortunately, the Hackintosh uses macOS Catalina. This version won't run many of paid and free software I'm using. Say good bye to my Adobe CS 5 suite, bought years ago, good bye to BBEdit (I'll buy the latest release ASAP), etc. My Dock is a graveyard of incompatible applications. Only sparkle of luck here: LightRoom 3 that seems to be pretty happy on macOS 10.15.6.
In less than one day and a half I've moved from a broken multi-head virtualized workstation to bare metal PCs running up-to-date OSes on top of up-to-date hardware. Still MIA, the virtualization hardware to re-create my lab.
What saved me:
- backups
- preparedness and contingency plan
- backups again
Things to do:
- put the Hackintosh into a fanless case
- add an SSD for Time machine
- add second drive in Windows 10 PC for backups
- buy another NUC for virtualization lab
- buy missing software or find alternatives
 Few days ago I've bought a USB keylogger to use on my own computers (explanation in french